Adding a Grafana Dashboard to Your Prometheus Setup
Introduction
This article is part of a series on setting up an end-to-end monitoring and alerting stack using Prometheus.
Continuing our series on setting Prometheus in a Docker container, we will add a Grafana instance to our Prometheus setup.
Please refer to the previous article where we use docker compose to run Prometheus and Alertmanager together as that forms the basis to run multiple related containers. We will add a container to run Grafana to the same compose file in this article.

- Introduction
- Adding a Grafana Container to our Docker Compose
- Adding a Dashboard
- Troubleshooting
- Conclusion
- References
Adding a Grafana Container to our Docker Compose
First, create a volume for Grafana's data:
docker volume create grafana-data
Now edit your docker-compose.yml in your prometheus directory and add the volume to the volumes section:
volumes:
    prometheus:
        external: true
    alertmanager:
        external: true
    grafana-data:
        external: true
We'll use the grafana-enterprise:11.4.0-ubuntu image to run Grafana. Under services, add the following:
  grafana:
    image: grafana/grafana-enterprise:11.4.0-ubuntu
    ports:
      - 3005:3000
    volumes:
      - grafana-data:/var/lib/grafana
    restart: always
    links:
      - prometheus:prometheus
We've added a link to the prometheus container so that Grafana can find and use Prometheus as a data source.
Your complete docker-compose.yml should look like this:
volumes:
    prometheus:
        external: true
    alertmanager:
        external: true
    grafana-data:
        external: true

services:
  prometheus:
    image: prom/prometheus:v3.0.0
    volumes:
      - ./config:/etc/prometheus
      - prometheus:/prometheus
    ports:
      - 9000:9090
    restart: always
    links:
      - alertmanager:alertmanager

  alertmanager:
    image: prom/alertmanager:v0.27.0
    ports:
      - 9001:9093
    volumes:
      - ./alertmanager-config/:/etc/alertmanager/
      - alertmanager:/alertmanager
    restart: always
    command:
      - '--config.file=/etc/alertmanager/alertmanager.yml'
      - '--storage.path=/alertmanager'
      - '--log.level=debug'

  grafana:
    image: grafana/grafana-enterprise:11.4.0-ubuntu
    ports:
      - 3005:3000
    volumes:
      - grafana-data:/var/lib/grafana
    restart: always
    links:
      - prometheus:prometheus
Grafana should be accessible at http://localhost:3005. To login for the first time, use the default credentials:
- Username: admin
- Password: admin
Once logged in, go to http://localhost:3005/connections/datasources/new and choose "Prometheus". The only parameter we need to worry about here is the Prometheus server URL.
Set it to http://prometheus:9090. How does this work? We've linked the Prometheus container to the Grafana container, so the Prometheus container is accessible at prometheus:9090. Click on "Save and Test" to test the datasource connection.
Your Grafana is now ready and linked to your Prometheus instance.
Adding a Dashboard
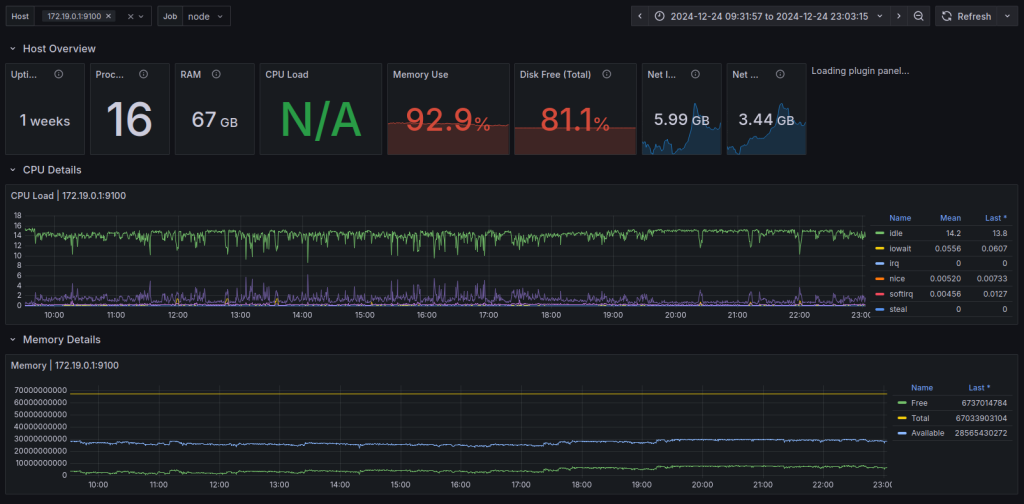
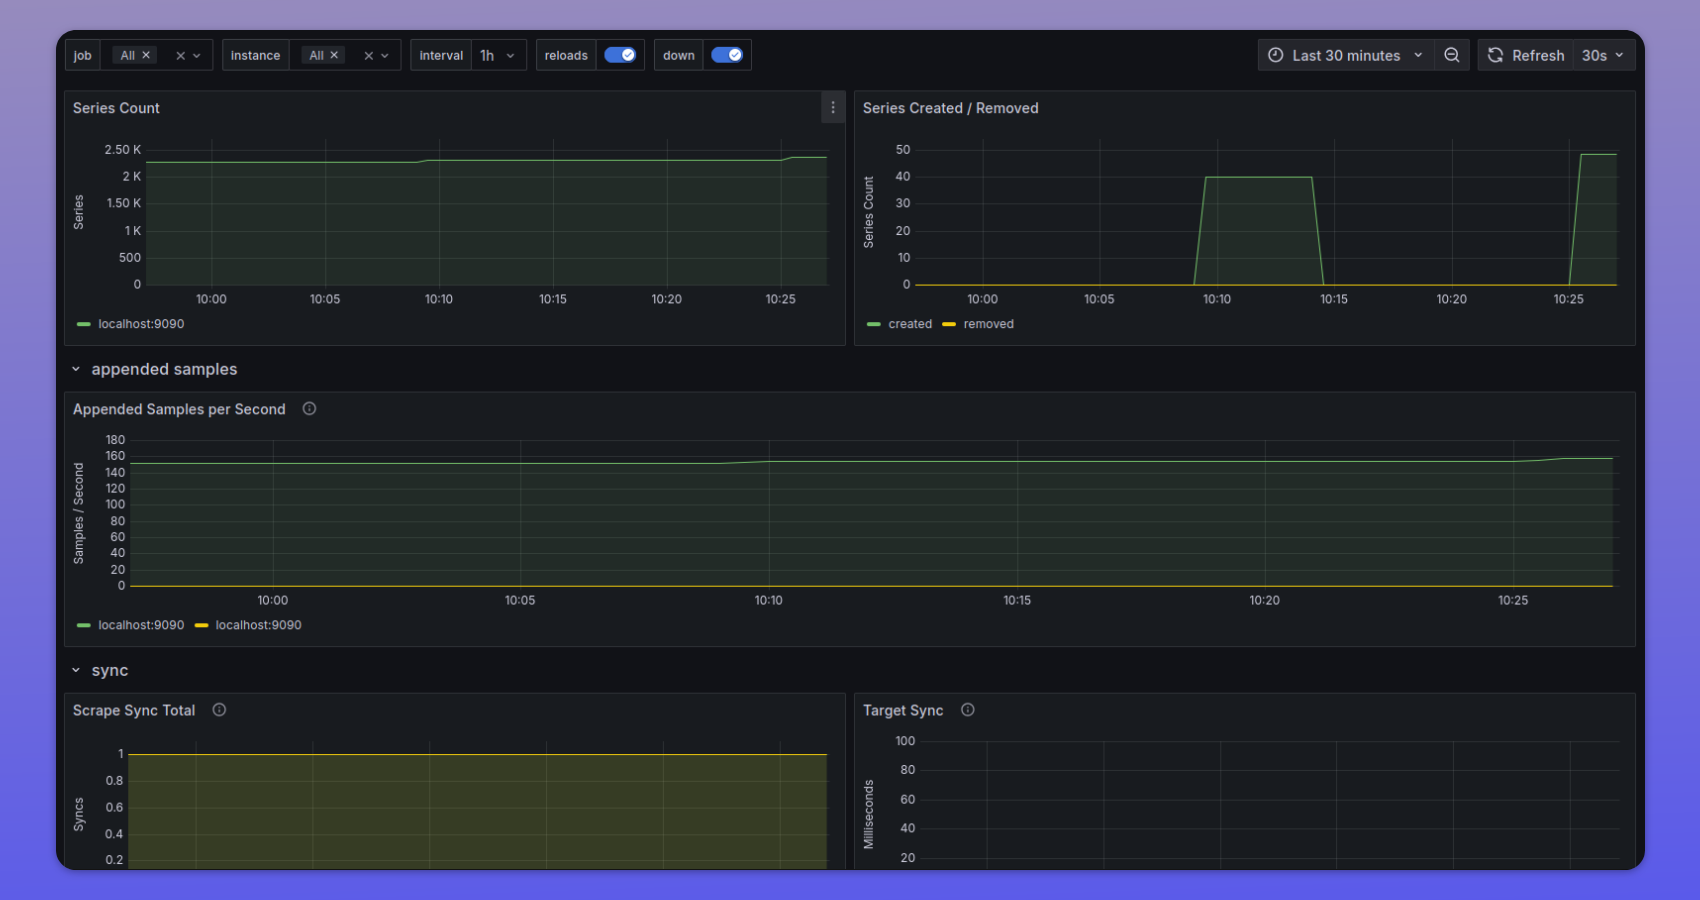
There are hundreds of ready-made dashboards available for Grafana. Since we have only Prometheus's own metrics in our setup, we will use a dashboard to visualize our Prometheus metrics. If you have added other exporters to your Prometheus you can use their dashboards, or create one from scratch.
- Download the dashboard from https://grafana.com/grafana/dashboards/3662-prometheus-2-0-overview/
- Go to
http://localhost:3005/dashboardsand click on "New"->"Import" - Click on "Upload dashboard JSON file" and select the file you downloaded.
- For "Choose a Prometheus data source", select the datasource you created earlier.
- Click on "Import" and you should see your dashboard.

Congratulations! You have just setup a dashboard to visualize your Prometheus metrics. From here, you can do much more:
- Setup other exporters for Prometheus and add dashboards for them.
- Monitor Alertmanager itself with its own dashboard.
- Grafana has a ton of other features including alerting, annotations, and integration with other monitoring tools.
Troubleshooting
My datasource "Save and Test" fails
- Check that the Prometheus server URL is correct. The name of the Prometheus host should match what is set under
linksin thedocker-compose.ymlfor thegrafanaservice, and the port should match the Prometheus container port - default being 9090. - Check that the Prometheus container is running.
I cannot see any data in my dashboard
- Check that you have the correct datasource set for the dashboard. One way to troubleshoot is to query the datasource directly from Grafana for a known metric.
- Edit one of the panels in the dashboard and check if you can see the metric. If not, then check if your Prometheus container is collecting metrics by checking the Prometheus UI.
Only some of the panels in my dashboard show data
- This is most likely because some of the panels are querying metrics that don't exist
If I restart my containers, the dashboard is gone
- Grafana stores the dashboard configuration in the
grafana-datavolume. If you deleted the volume, or changed its name in thedocker-compose.yml, your setting will be lost.
Conclusion
Grafana is a powerful dashboarding software that you can use to visualize your metrics from different sources, not just Prometheus.
References
You might also like:
- A Beginner's Guide To Service Discovery in Prometheus
- Sending Alerts Using Prometheus and Alertmanager
- Deploying Prometheus With Docker
- How to Configure a Remote Data Store for Prometheus
This article was originally published on the IncidentHub blog.
All product names, company names, logos and trademarks are the property of their respective owners. IncidentHub is not affiliated with any of the vendors mentioned in this article.

