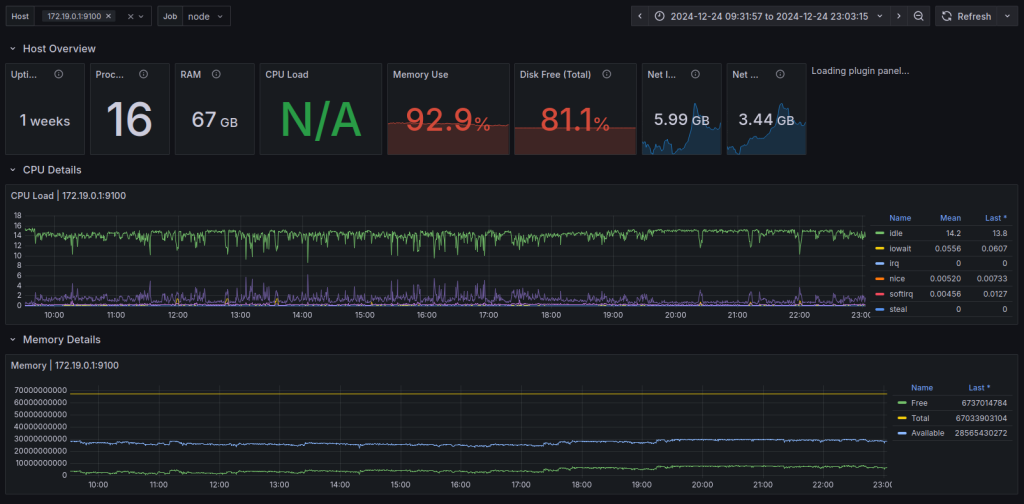
Adding a Grafana Dashboard to Your Prometheus Setup
Introduction
This article is part of a series on setting up an end-to-end monitoring and alerting stack using Prometheus.
Continuing our series on setting Prometheus in a Docker container, we will add a Grafana instance to our Prometheus setup.
Please refer to the previous article where we use docker compose to run Prometheus and Alertmanager together as that forms the basis to run multiple related containers. We will add a container to run Grafana to the same compose file in this article.


