Why IncidentHub's Alerting is Better than Other Status Page Aggregators'
· 23 min read

The Alert Fatigue Problem in SaaS Dependent Teams
IncidentHub tracked 48000 SaaS and Cloud outages in 2025. The average organization depends on 100+ SaaS apps, making third-party vendor monitoring a crucial aspect of risk management and business continuity for almost all modern organizations.
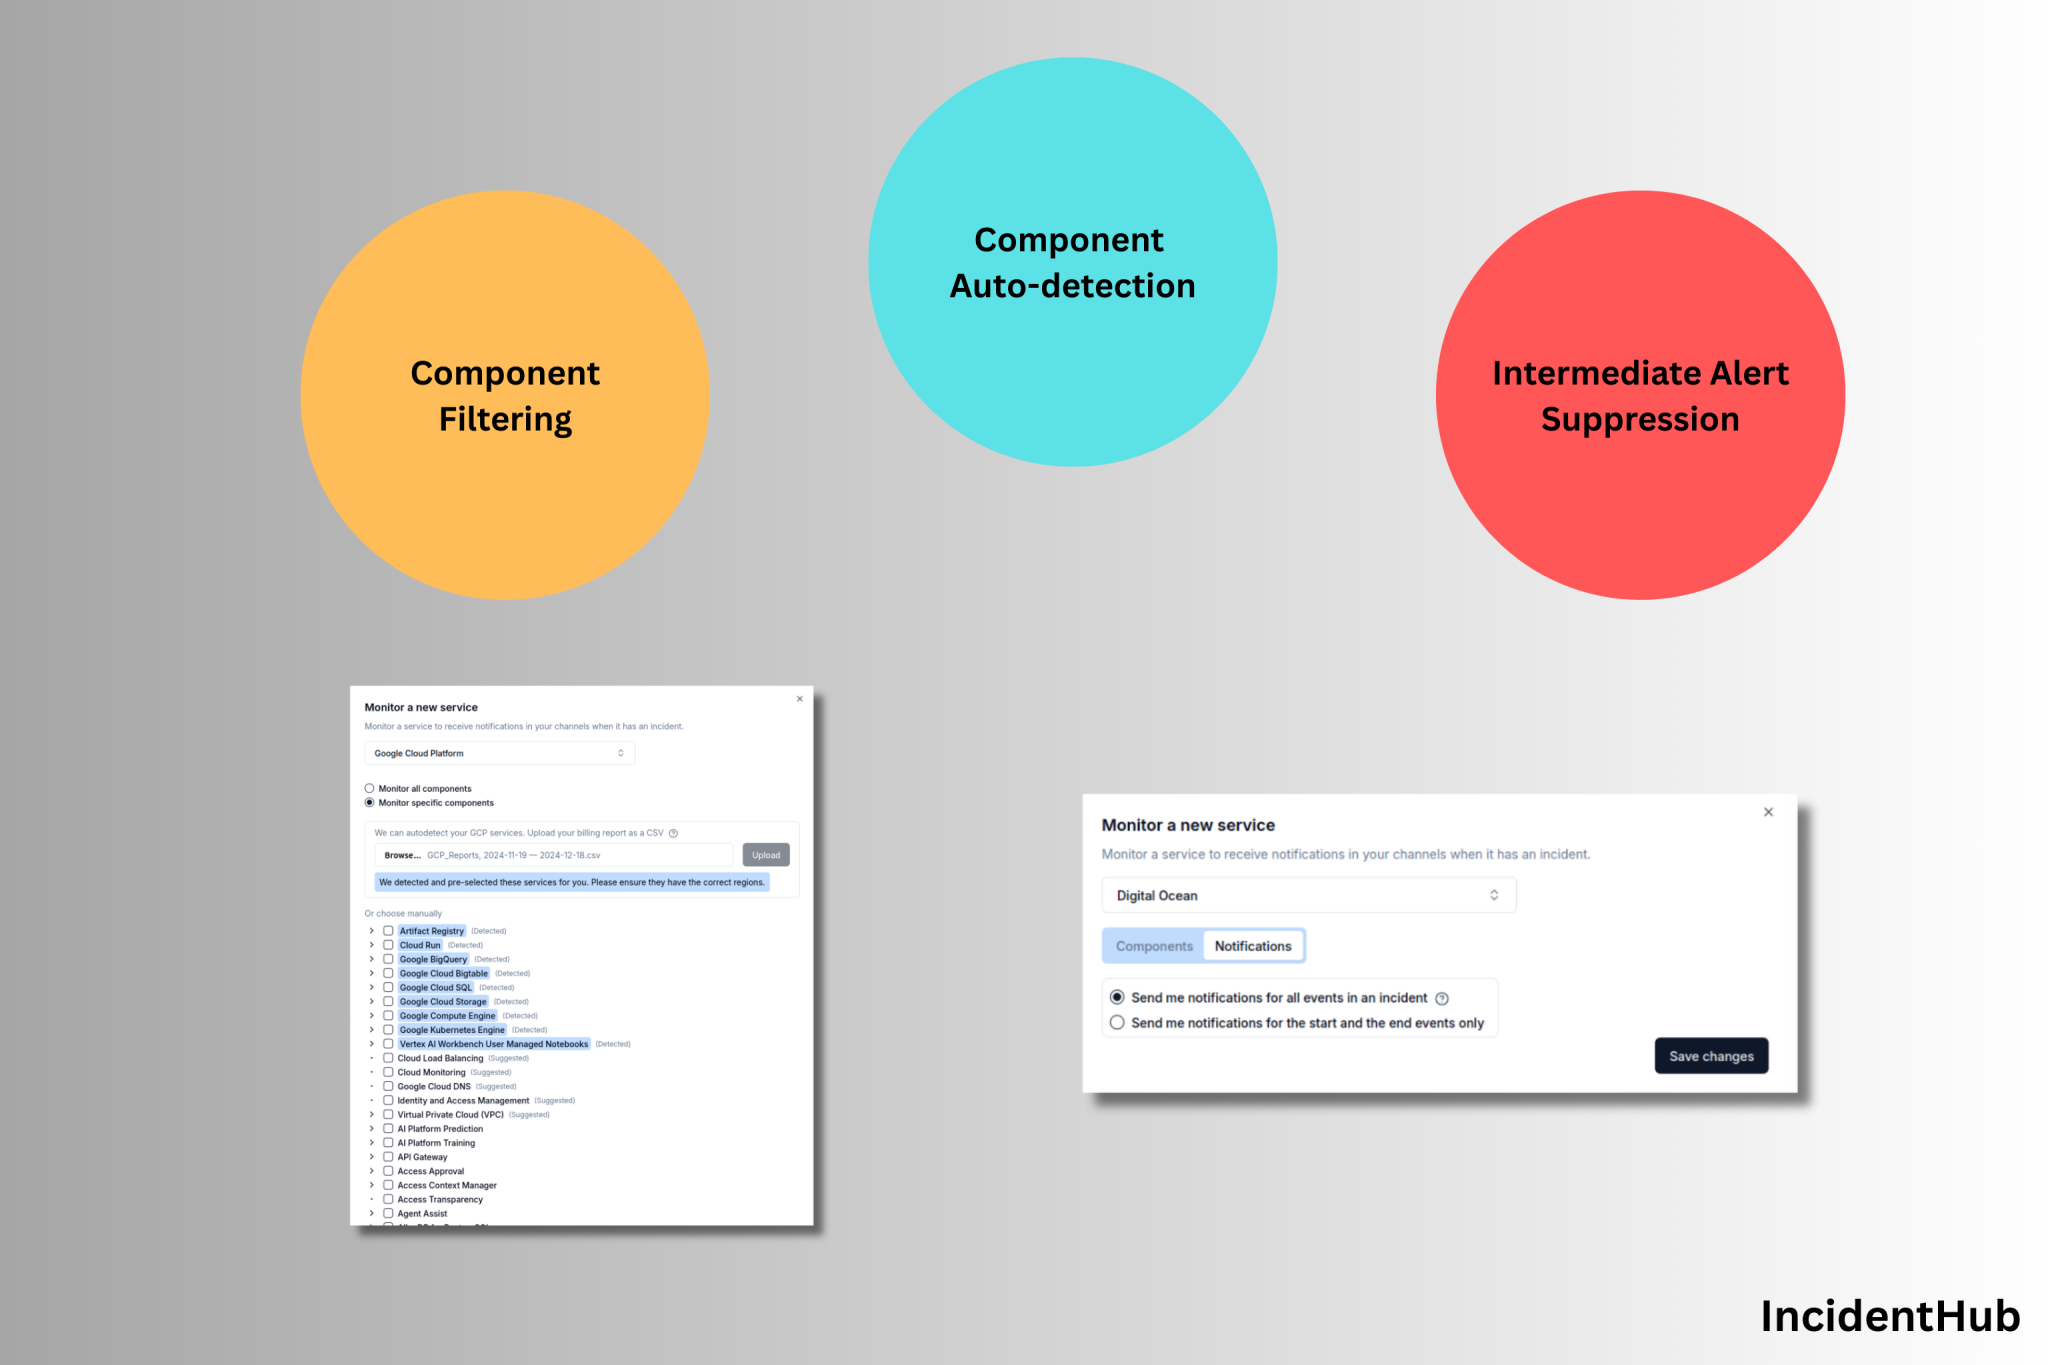
Better SaaS outage alerting is about monitoring the right parts of your third-party services, and routing alerts to the right people at the right time.
This article covers the six criteria that separate useful cloud outage alerts from noisy ones, how IncidentHub's alerting works, real-world scenarios where it matters, and who this tool is built for.