A Beginner's Guide To Service Discovery in Prometheus

Introduction
This article is part of a series on setting up an end-to-end monitoring and alerting stack using Prometheus.
Service discovery (SD) is a mechanism by which the Prometheus monitoring tool can discover monitorable targets automatically. Instead of listing down each and every target to be scraped in the Prometheus configuration, service discovery acts as a source of targets that Prometheus can query at runtime.
Service discovery becomes crucial when there are dynamically changing hosts, especially in microservices architectures and environments like Kubernetes. In Prometheus parlance, service discovery is a way of discovering "scrape targets".

For example, pods are created dynamically in Kubernetes as a result of new services being deployed and undeployed, autoscaling events, and errors causing pods to crash and go away. If you are using Prometheus for scraping pods in such an environment, Prometheus has to know which pods are running and scrapable at any given point in time. The Kubernetes service discovery pluging enables this. Similarly, there are SD plugins for other common environments.
You can use service discovery in Prometheus with the predefined plugins, or write your own custom ones using file or HTTP, depending on the situation.
- Introduction
- Types of Prometheus Service Discovery
- Configuring Service Discovery in Prometheus
- Combining Multiple Service Discovery Mechanisms
- Troubleshooting Service Discovery
- Conclusion
- FAQs
Types of Prometheus Service Discovery
Predefined Mechanisms in Prometheus
Prometheus has out of the box support for discovering scrape targets for many popular environments, including:
- Amazon Web Services (EC2 instances)
- Azure (Azure VMs)
- Consul
- Digital Ocean
- DNS
- Google Cloud Platform (Google Compute Engine VMs)
- Hetzner
- Kubernetes
- Linode
- OpenStack
This list is not exhaustive. For the full list, see the the Prometheus GitHub repository.
Custom Service Discovery in Prometheus, or Writing Your Own
You may have infrastructure or application endpoints that cannot be discovered by the standard mechanisms. In such cases you can use write your own. There are two options available.
HTTP based service discovery
You can write an HTTP-based mechanism and return the scrape target information in response to Prometheus' GET requests. Prometheus will perform a GET request periodically - by default every 1 minute. This periodic request is made so that Prometheus has the latest list of targets. You can see this as a configurable parameter in the standard SD configurations of AWS and others, and you can also include it in your SD configuration as "refresh_interval". Note that this interval is different from the scrape_interval, which is used by Prometheus to scrape the targets themselves.
There are a few basic requirements for HTTP service discovery:
- Response should be in JSON with the correct HTTP
Content-Typeheader. - The content must be in
UTF-8. - Authentication if required can be Basic, using the Authorization header, or OAuth 2.0. You would typically not need authentication if the endpoint is in your internal network, or part of your applications.
- If there are no scrape targets, the endpoint should return an empty list.
A sample configuration for an HTTP service discovery mechanism can look like this:
http_sd_config:
  url: 'http://192.168.2.34/api/internal/hosts'
  refresh_interval: 600
  http_headers:
    "Purpose":
      values: ["Prometheus-scraper"]
Internally, your HTTP endpoint would query a database or inventory to fetch the list of targets and return them.
File based service discovery
File-based service discovery is another alternative if you need to provide a custom list of scrape targets. To do this, you can create a file and list down your scrape targets in it. It is important to note that this is also a dynamic mechanism like HTTP service discovery. Prometheus will check for changes to the file at periodic intervals. This interval is configured with the "refresh_interval" key, just like in others. The default is 5 minutes.
Requirements for file based service discovey:
- Files can be in JSON or YAML.
- You can specify a pattern to match multiple files. This is helpful if you wish to keep your scrape targets grouped logically across separate files.
- Malformed JSON or YAML files are ignored, so ensure that they conform to the required format.
In the Prometheus configuration, you can specify it as follows:
file_sd_config:
  files:
    - "/etc/prometheus/external/targets/*.yml"
    - "/opt/monitoring/targets/prod-*.yml"
    - "/data/dynamic-targets-[0-9]*.yaml"

  refresh_interval: 120
Configuring Service Discovery in Prometheus
Like everything else, service discovery configurations go into the configuration file which is prometheus.yml by default.
Basic Syntax
For predefined SD mechanisms, the top level YAML key is x_sd_config, where x is the environment name. You can find the complete list in the docs.
Each mechanism has a set of common keys like refresh_interval, and then keys specific to the environment.
Here is an example AWS config which generates a dynamic list of node exporter scrape targets for EC2 VMs:
# AWS Region Configuration
region: "us-west-2"
endpoint: "https://ec2.us-west-2.amazonaws.com"

# AWS Authentication (using role ARN in this example)
role_arn: "arn:aws:iam::123456789012:role/PrometheusServiceDiscovery"

refresh_interval: 300s
port: 9100  # Default port for node_exporter

# EC2 Instance Filters
filters:
  - name: "tag:Environment"
    values: ["production"]
  - name: "instance-state-name"
    values: ["running"]
  - name: "tag:Service"
    values: ["web", "api"]
  - name: "vpc-id"
    values: ["vpc-0abc123def456789"]

follow_redirects: true
enable_http2: true
For HTTP and file based mechanism the syntax is similar, and much simpler. Refer to the sections above for samples.
Target Relabeling and Filtering
Target relabeling is a technique which is applied to the labels of the target (machine, pod, endpoint, etc) before it is scraped. Labels are key value pairs attached to a metric that allow us to categorize the metric. Note that target relabeling can be used for static scrape configurations also and not just for SD-based ones.
E.g. code is the label in the following metric:
promhttp_metric_handler_requests_total{code="200"} 0
Since target relabeling is applied before scraping happens, we can use it to filter our metrics we don't care about, and also modify labels.
An example use case of modifying labels in AWS is to scrape the public IP address of the instance instead of the private one. By default, the private IP address is used.
scrape_configs:
  - job_name: 'ec2-instances'
    ec2_sd_configs:
      - region: us-west-2
        port: 9100
        filters:
          - name: "instance-state-name"
            values: ["running"]

    relabel_configs:
      # Drop targets without public IP addresses
      - source_labels: [__meta_ec2_public_ip]
        regex: ''
        action: drop

      # Use public IP instead of private IP
      - source_labels: [__meta_ec2_public_ip]
        target_label: __address__
        replacement: '${1}:9100'
        action: replace
This configuration does the following
- Lists running instances only.
- Drops instances without a public IP.
- Set the
__address__label in the target to point to the public IP and the node exporter port (9100).
The __address__ is a special label used by Prometheus to determine the final address and port in a target for scraping.
The __meta__ prefix indicates special labels that are provided by the SD plugin. It's a way of bringing in metadata from your cloud provider (or other environment) into your metric labels.
Here is another example for Google Cloud illustrating the second point about __meta__ :
- job_name: node
    honor_labels: true
    gce_sd_configs:
      - project: ml-platform-a
        zone: us-eastl1-a
        port: 9100
    relabel_configs:
      - source_labels: [__meta_gce_label_cloud_provider]
        target_label: cloud_provider
      - source_labels: [__meta_gce_label_cloud_zone]
        target_label: cloud_zone
      - source_labels: [__meta_gce_label_cloud_app]
        target_label: cloud_app
      - source_labels: [__meta_gce_label_team]
        target_label: team
      - source_labels: [__meta_gce_instance_name]
        target_label: instance
Verifying Your Configuration
Run your configuration using a YAML linter first. If there are no errors, run Prometheus with the configuration and check for the following:
- Are you seeing metrics from the intended targets?
- Do the metrics have the correct labels?
- When you add or remove a target (pod, host, etc), does it reflect in your metrics?
Handling Secrets
In the above AWS example, we could have used AWS API keys instead of AWS Role ARN. However, your configuration file should be stored in a source code repository, and we obviously don't want to store the keys in the committed file. There are different options for handling this depending on your deployment infrastructure.
E.g. If you are using Kubernetes, you can use Helm with the helm-secrets plugin to deploy Prometheus. Helm will seamlessly decrypt the secrets and place them in the final rendered version of your Prometheus deployment.
Trouble keeping up with dozens of status pages?
IncidentHub can help you keep track of your third-party service statuses.
Combining Multiple Service Discovery Mechanisms
You can add as many SD configurations as you want to a single Prometheus configuration. Some example setups could be:
- Multiple cloud vendors: Watch out for cross-cloud access in such cases, where you have to deal with encryption of in-transit data as well as authentication. A better option here is to run one Prometheus in each cloud account or environment.
- Multiple regions or zones in the same cloud vendor: Here also, you might find yourself dealing with data transfer costs between regions. A full discussion of this topic is beyond the scope of this article.
- Hybrid environments like your on-premises VMs and your cloud vendor's instances.
- Cloud native deployments like Kubernetes and virtual machines with the same cloud vendor.
Troubleshooting Service Discovery
The first sign that your SD configuration is not working - either partially or at all - is missing metrics. Let's look at a few common issues and how to troubleshoot them.
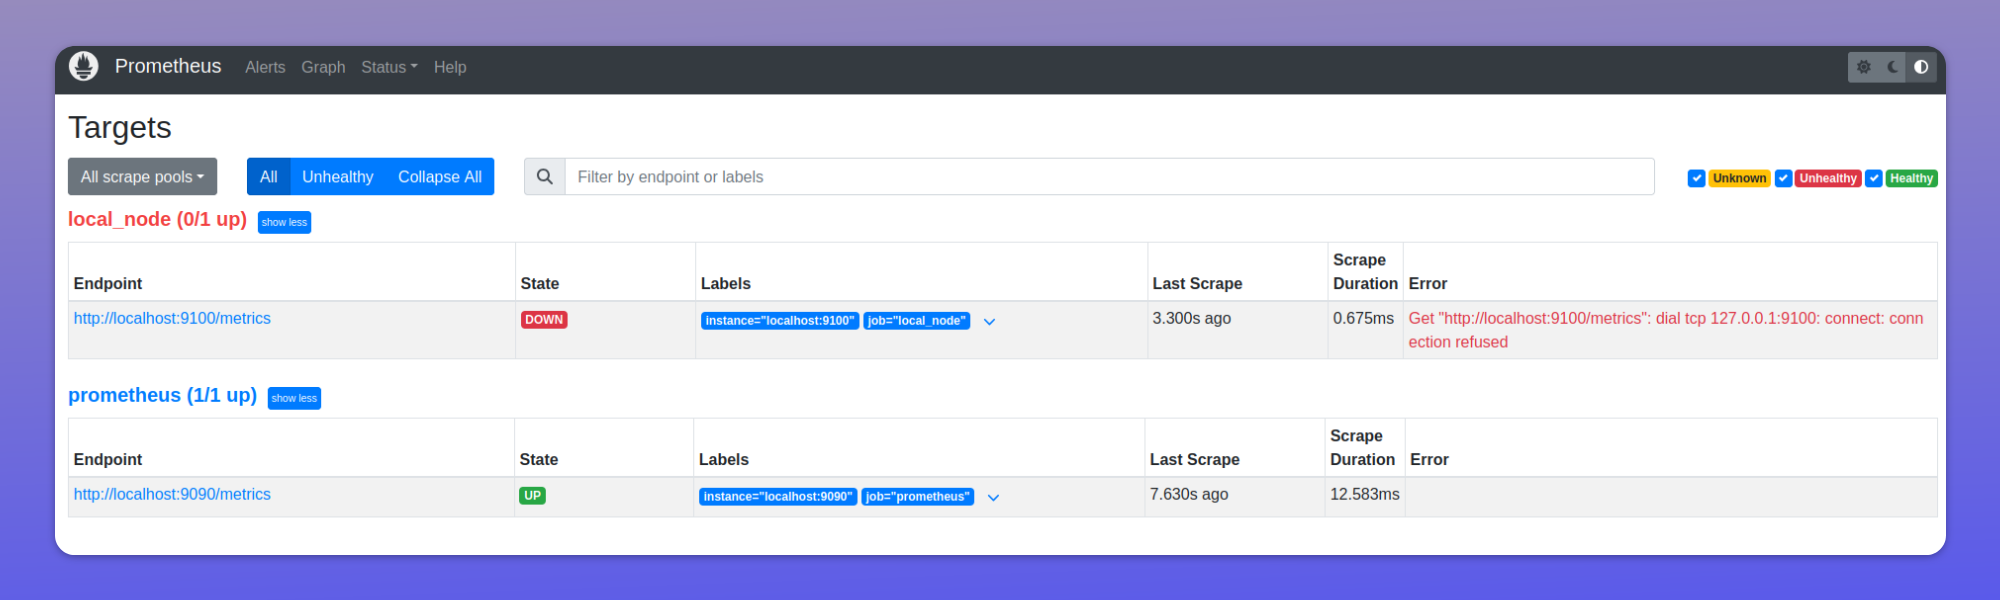
Prometheus failing to scrape some or all targets
Check for any error messages in your Prometheus dashboard
http://prom-ip:prom-port/targets
Failed targets would be marked "Down" in red. The Error message should give you an idea of why it could not be scraped.
Target list is not refreshed, or Prometheus is not scraping new targets, or Prometheus is attempting to scrape dead targets
- If it's a custom SD mechanism like HTTP or file, check if the endpoint is able to fetch data from your db or inventory systems. Prometheus can only scrape what your SD endpoint provides.
- If it's an inbuilt SD mechanism like AWS or GCP, check if your cloud credentials are correct, and if the refresh_interval is reasonable.
- Check that your filters are correct and not dropping valid targets.
Wrong labels are showing up in metrics, or not showing up at all
This is usually a problem with the relabel_config. If you have multiple config lines, remove all of them except the first one. If that works, add them back one by one until you hit the problematic one.
Conclusion
Service Discovery in Prometheus is a powerful way of discovering scrape targets in dynamic environments. It offers you the flexibility of being able to use in-built plugins for common cloud providers and environments, and also write your own custom plugin for your systems.
FAQs
What is Service Discovery in Prometheus?
It's a mechanism for automatically discovering monitoring targets instead of manually listing them in the Prometheus configuration.
Where is Prometheus Service Discovery useful?
It's useful in dynamic environments where hosts change frequently, especially in microservices and Kubernetes environments.
What are the key types of Prometheus Service Discovery?
There are predefined plugins (AWS, Azure, Kubernetes, etc.) and custom options (HTTP-based or File-based).
How often does Prometheus refresh its target list?
By default, every 1 minute for HTTP-based and 5 minutes for file-based discovery, but this is configurable via the refresh_interval key.
How do I configure Prometheus Service Discovery?
Add service discovery configurations to prometheus.yml using the format x_sd_config, where 'x' is the environment name (e.g., ec2_sd_config).
How should secrets be handled in a Prometheus Service Discovery configuration?
Use tools like helm-secrets if you are using Helm with Kubernetes or similar secret management solutions; avoid storing secrets in configuration files.
How can I verify if Prometheus Service Discovery is working?
Verify that metrics are visible from intended targets, labels are correct, and new/removed targets are reflected in metrics.
What should I check if targets aren't being scraped?
Check the Prometheus dashboard's /targets page for error messages, verify credentials and permissions, check refresh_interval settings, and ensure custom SD endpoints are functioning if applicable.
What are the requirements for HTTP-based Service Discovery?
It needs JSON response with correct Content-Type, UTF-8 encoding, Basic or OAuth 2.0 authentication (if required), and empty list response if no targets exist.
What formats are supported for file-based Service Discovery?
Both JSON and YAML formats are supported.
You might also like:
- Adding a Grafana Dashboard to Your Prometheus Setup
- Sending Alerts Using Prometheus and Alertmanager
- Deploying Prometheus With Docker
- How to Configure a Remote Data Store for Prometheus
This article was originally published on the IncidentHub blog.
All product names, company names, logos and trademarks are the property of their respective owners.