Monitoring Specific Components and Regions in Your Third-Party Services
Chances are, most of your third-party cloud and SaaS dependencies are globally distributed and have many regions of operation. Chances are, your applications use a subset of a cloud or SaaS service. If you are monitoring such a service, why should you receive alerts for all regions or every single component in the service?
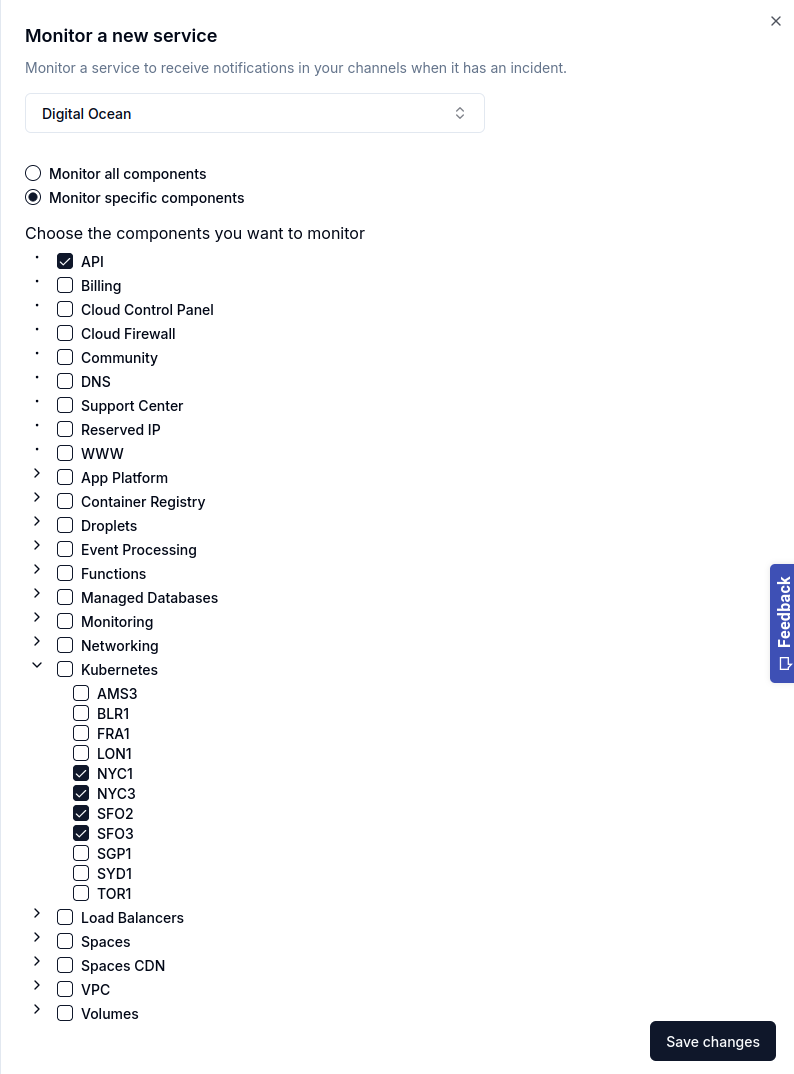
E.g. if you use Digital Ocean, you might be using Kubernetes in their US locations (NYC and SFO). You would want to know only when there is an outage in one of these locations. Digital Ocean's status page gives you the option to subscribe to outages across the board - it’s all or nothing. This is the case with most services with a few exceptions.
Choosing Specific Components to Monitor
You can now choose which components/regions you wish to monitor in IncidentHub. Let us continue with our Digital Ocean example.
You can choose to monitor all components:

or a subset that is relevant to you:

Once you save this configuration, you will be alerted only for outages that affect these components.
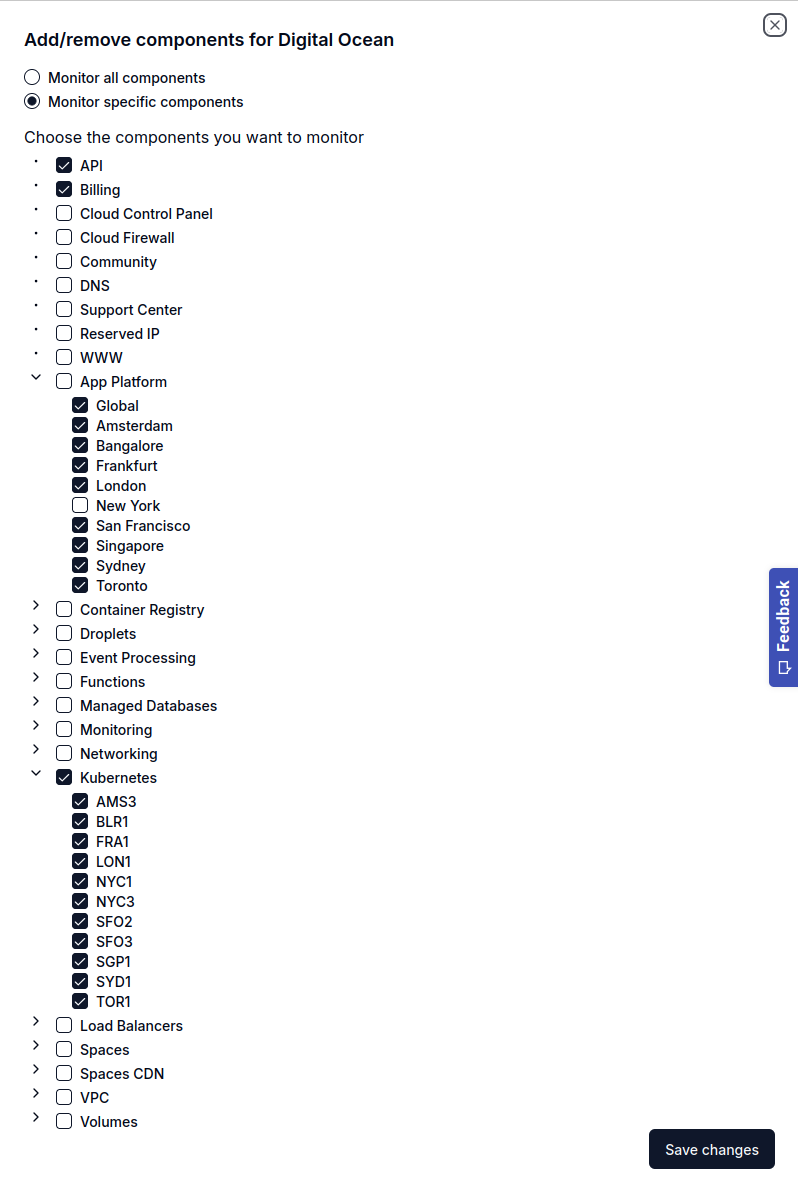
Adding/Removing Components
You can always go back and edit the components later. This is helpful when you start using say, Kubernetes in a new region, or new components. In your IncidentHub dashboard, you should see the "Edit Components" button next to your list of services.

Benefits
- This new feature will help you to receive only relevant and actionable alerts. If you are a developer you need not worry about receiving irrelevant alerts for components your application does not even use.
- SRE/Ops teams can react to infrastructure issues quicker without wading through noise and correlate those with outages reported in their own applications.
- If you are in an IT Team with hundreds or thousands of users depending on tools like Zoom, Slack, or Google Workspace, you can react to issues before your users start logging helpdesk tickets.
This powerful new feature, which significantly reduces alert noise, is being rolled out to eligible services as of this writing. Log in to your IncidentHub account today to start customizing your monitoring settings. For a step-by-step guide on how to set up your custom monitoring preferences, check out our knowledge base article. We would love to hear how this new feature is working for you.
If you don't have an IncidentHub account yet, sign up for a free (forever) account and try it out.
Watch this blog or our X/LinkedIn feeds for updates on more exciting new features.

