Introduction
A newer and expanded version of this article is available here.
Last updated on August 8, 2025.
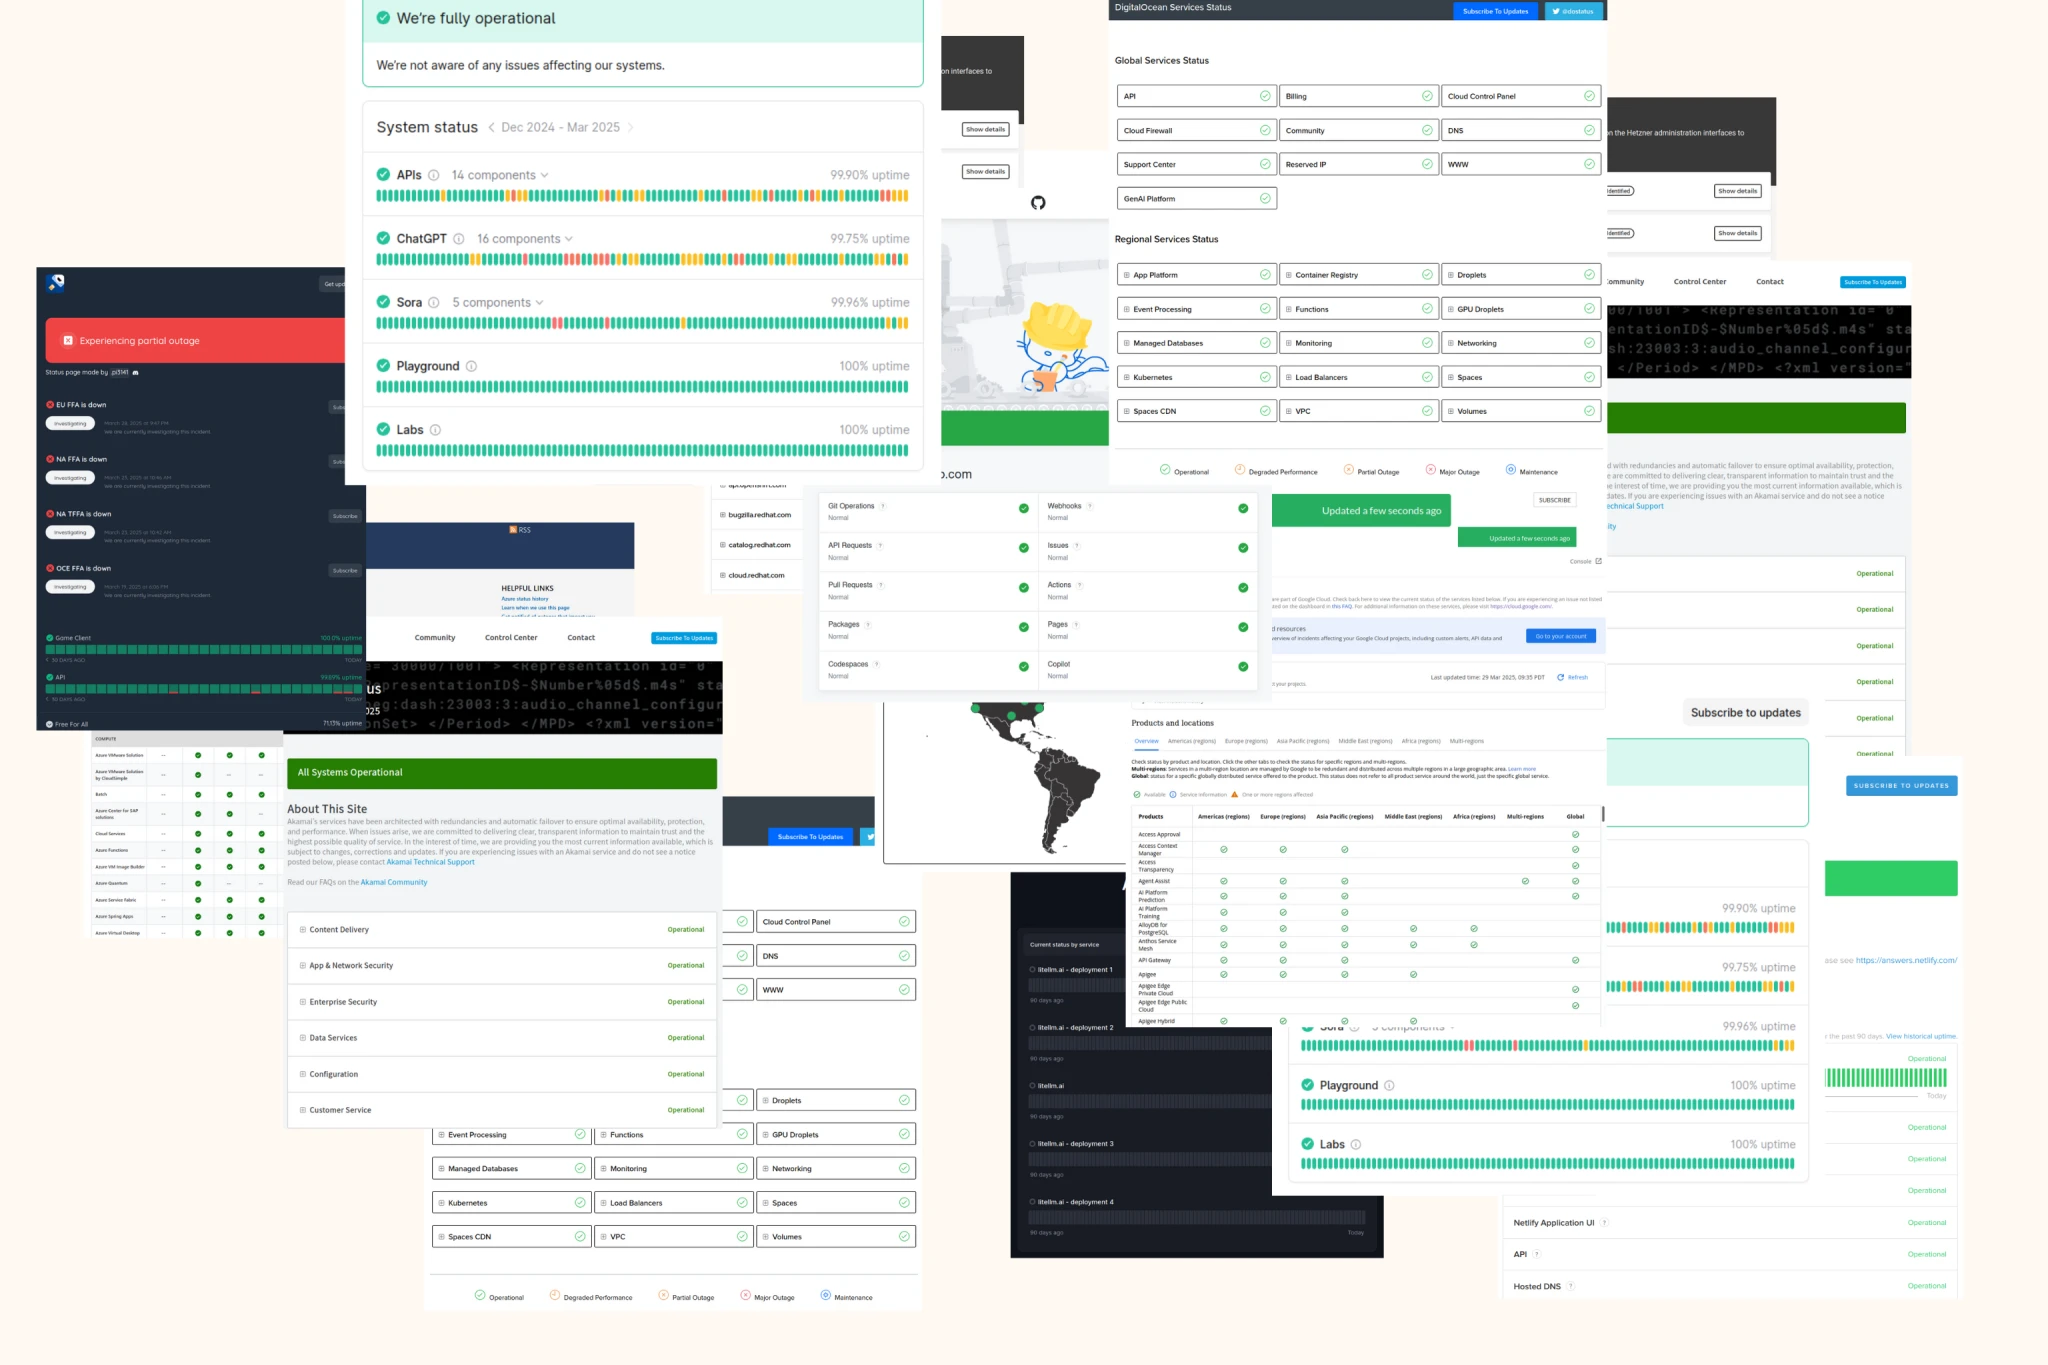
Incident updates on the public status pages of your SaaS vendors and cloud providers are often the first indication that they might have an outage.
Providers also post updates about upcoming and ongoing maintenance on their status pages. Monitoring your SaaS and cloud
status pages to detect downtime becomes crucial to your business operations. This article will guide you through the process of
effectively monitoring such status pages.
There are two ways to monitor multiple status pages:
- The manual process.
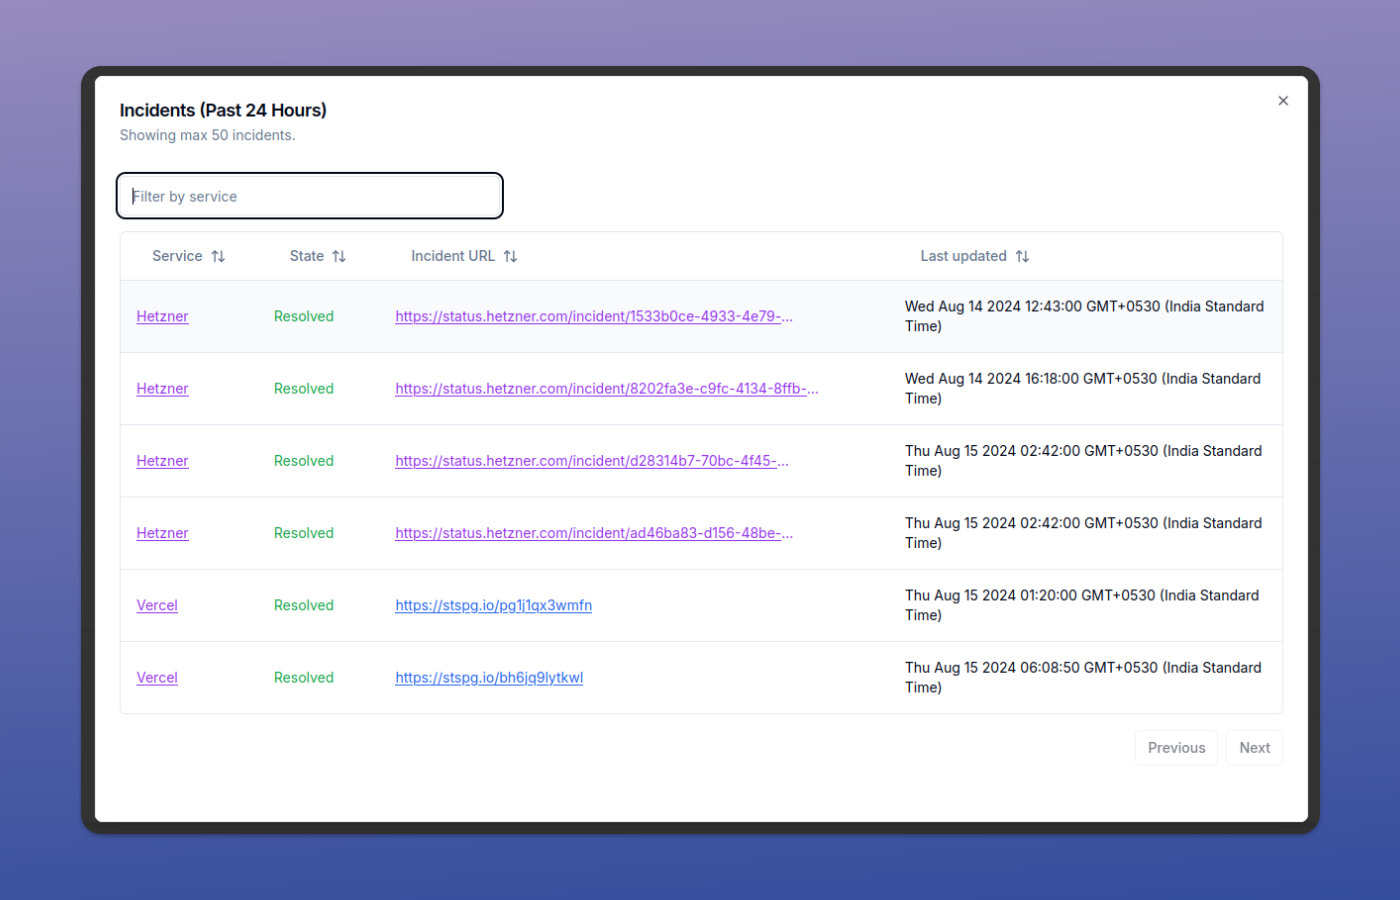
- Using a status page aggregator like IncidentHub.
If you are using the second option, which is the recommended approach, you can skip directly to the section on Use a Status Page Aggregator Tool.
In either case you will need to identify your cloud providers and locate their public status pages first.