
One post tagged with "availability"

IncidentHub posts related to availability

View All Tags

Incident Archaeology – Dig Into Your Services' Past With IncidentHub's Availability Page

· 3 min read
Hrishikesh Barua
Founder @IncidentHub.cloud

A few weeks ago we released a feature on IncidentHub which gives you a historical view of your monitored services' availability.

Why Was This Needed?

On the dashboard where you can add services and channels, there is an overview panel that shows total incidents in the last 24 hours. You can get into a more detailed view by clicking on the button next to it. This opens up a popup where you can see active and resolved incidents - in the last 24 hours - and filter them by service.

View Incidents Popup

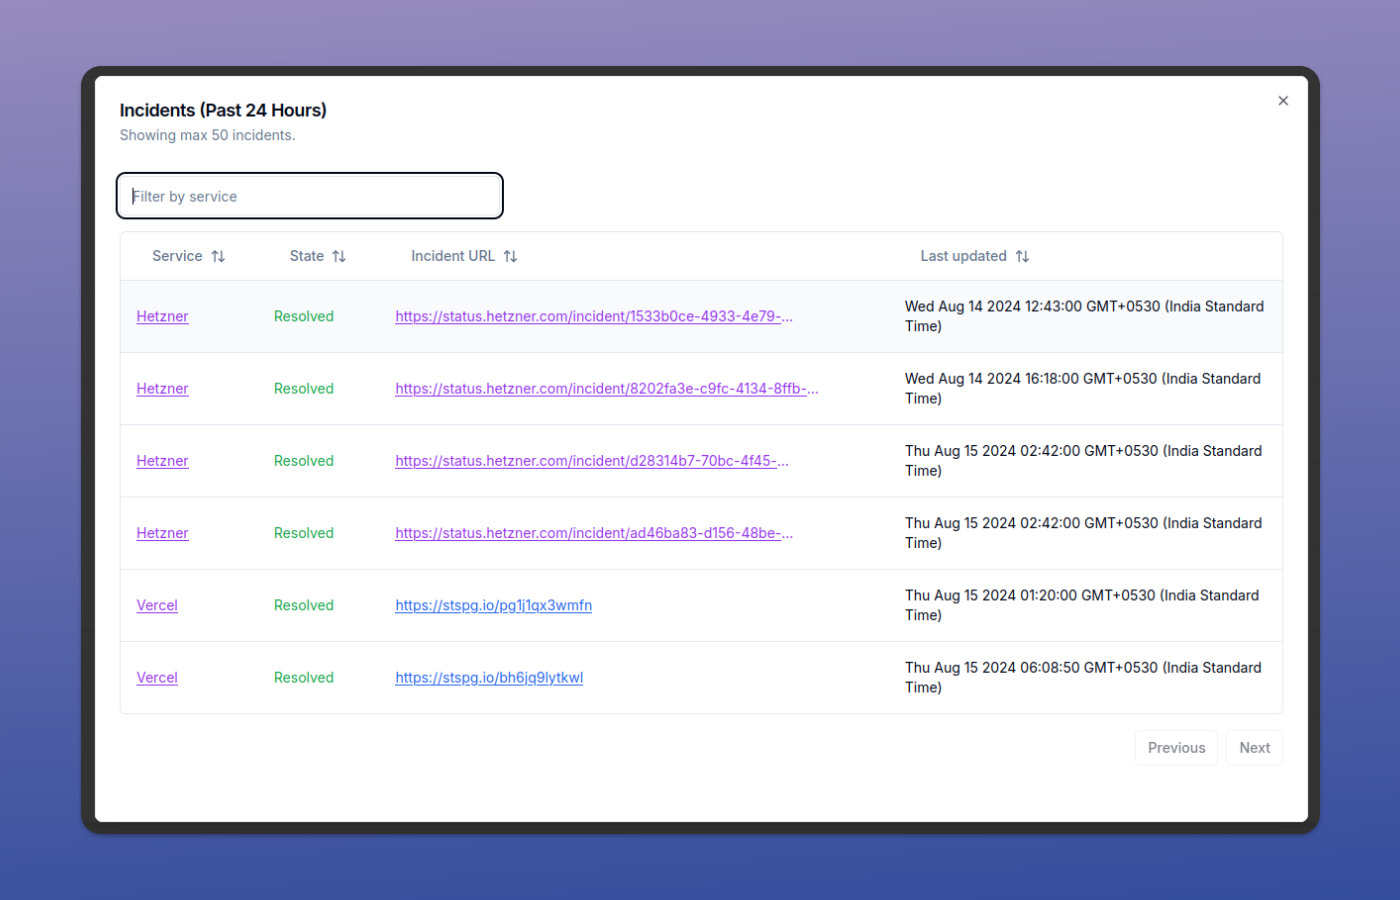
This panel is good enough for a quick view on what's affecting your dependent services. However, sometimes there is a need to look back further. This is what the Availability page gives you - an overview of service health over the last 30 days.

Let's look at a few examples:

  • You are investigating an outage with your applications which had a significant impact and more than one cause. One of the reasons was an outage with one of your third-party services. You are writing the post-mortem report after 2 days and need to refer to the third-party outage's incident report, which you can find on the Availability page.
  • After starting a long-running performance test, you look at the result after a couple of days and notice a blip in the graph. You suspect your cloud provider's network had an issue 2 days ago. You can check the Availability page for your cloud provider's health at that time.
  • One of your customers raised a support ticket complaining about an unavailable API a few days ago. You need to check your own historical metrics, and if there was an incident, correlate that with your third-party services' uptime.

The Availability page looks like this:

Availability Page

Digging Deeper

The green bars show days when everything was fine as reported by the service's own status page. The red bars indicate when there were one or more incidents.

If you hover over the red bars, you would see one of two things:

Single Incident Days

When there was a single incident on that day, it will be a link whose text says "View Incident Details". Clicking on it will take you to the official incident page of the service.

Single Incident Day

Multiple Incident Days

When the service had multiple incidents on that day, the link text will say "Multiple incidents - click to visit the status page". This will take you to the official status page of the service.

Multiple Incidents Day

Some incidents can span multiple days. The Availability bars are a high-level view of a service's availability - they don't show the exact time of the outage. It's a quick and easy way to view the status of your third-party dependencies.

Find it useful? Something missing? Let us know - we are always looking for feedback. You can reach us at support@incidenthub.cloud or on X @Incident_Hub.

Follow the blog's feed or our LinkedIn page for more updates on exciting new features.