5 posts tagged with "prometheus"

IncidentHub posts related to Prometheus

View All Tags

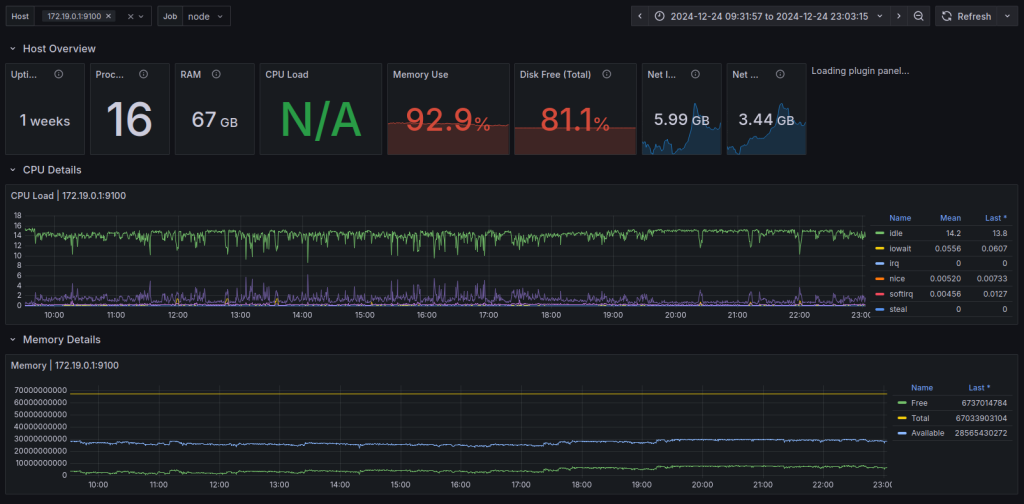
Adding a Grafana Dashboard to Your Prometheus Setup

· 5 min read
Hrishikesh Barua
Founder @IncidentHub.cloud

Introduction

This article is part of a series on setting up an end-to-end monitoring and alerting stack using Prometheus.

Continuing our series on setting Prometheus in a Docker container, we will add a Grafana instance to our Prometheus setup.

Please refer to the previous article where we use docker compose to run Prometheus and Alertmanager together as that forms the basis to run multiple related containers. We will add a container to run Grafana to the same compose file in this article.

Sending Alerts Using Prometheus and Alertmanager

· 9 min read
Hrishikesh Barua
Founder @IncidentHub.cloud

Introduction

This article is part of a series on setting up an end-to-end monitoring and alerting stack using Prometheus.

Continuing our series on setting up Prometheus in a container, this article provides a step-by-step guide for how to configure alerts in Prometheus. We will add alerting rules and deploy Prometheus Alertmanager with Slack integration.

If you follow the steps in this article, you will end up with a containerized setup for:

  1. A Prometheus instance with alerting rules.
  2. An Alertmanager instance which can send alerts originating from those rules to a Slack channel.

Let's get started.

Prometheus alerts

Deploying Prometheus With Docker

· 4 min read
Hrishikesh Barua
Founder @IncidentHub.cloud

Introduction

This article is part of a series on setting up an end-to-end monitoring and alerting stack using Prometheus.

There are different ways you can use to deploy the Prometheus monitoring tool in your environment. One of the fastest ways to get started is to deploy it as a Docker container. This guide shows you how to quickly set up a minimal Prometheus on your laptop. You can then extend that setup to add a monitoring dashboard, alerting, and authentication.

Deploying Prometheus in a Docker Container

Basic Setup

Running Prometheus in Docker is very simple using this command

docker run -p 9000:9090 prometheus prom/prometheus:v3.0.0

This will pull and run the latest version (as of this writing) of Prometheus. You can access the Prometheus UI at localhost:9000. Note that the container port 9090 is forwarded to the localhost port 9000.

How to Configure a Remote Data Store for Prometheus

· 9 min read
Hrishikesh Barua
Founder @IncidentHub.cloud

Introduction

This article is part of a series on setting up an end-to-end monitoring and alerting stack using Prometheus.

The Prometheus monitoring tool can store its metrics either locally or remotely. You can configure a remote data store using the remote_write configuration. This article describes the various data store options available as well as how to set up a remote store.

Overview of Remote Storage

By default, Prometheus stores data locally wherever it is installed. The data directory can be configured by using the --storage.tsdb.path command line option when starting Prometheus. In practice you can use a separate disk for higher performance attached to the machine where Prometheus is running.

However, this may not be possible or optimal in all situations as you might want a data store that is more suited for time series data, and has larger storage capabilities for higher data retention. Prometheus would usually run in a standalone VM or a Kubernetes pod or a Docker container, and it would not have access to such data stores by default.

A remote store can add these capabilities to Prometheus. The remote storage option can be set by using the remote_write key in the Prometheus configuration YAML file.

A Beginner's Guide To Service Discovery in Prometheus

· 11 min read
Hrishikesh Barua
Founder @IncidentHub.cloud

Introduction

This article is part of a series on setting up an end-to-end monitoring and alerting stack using Prometheus.

Service discovery (SD) is a mechanism by which the Prometheus monitoring tool can discover monitorable targets automatically. Instead of listing down each and every target to be scraped in the Prometheus configuration, service discovery acts as a source of targets that Prometheus can query at runtime.

Service discovery becomes crucial when there are dynamically changing hosts, especially in microservices architectures and environments like Kubernetes. In Prometheus parlance, service discovery is a way of discovering "scrape targets".

For example, pods are created dynamically in Kubernetes as a result of new services being deployed and undeployed, autoscaling events, and errors causing pods to crash and go away. If you are using Prometheus for scraping pods in such an environment, Prometheus has to know which pods are running and scrapable at any given point in time. The Kubernetes service discovery pluging enables this. Similarly, there are SD plugins for other common environments.

You can use service discovery in Prometheus with the predefined plugins, or write your own custom ones using file or HTTP, depending on the situation.
Prometheus logo