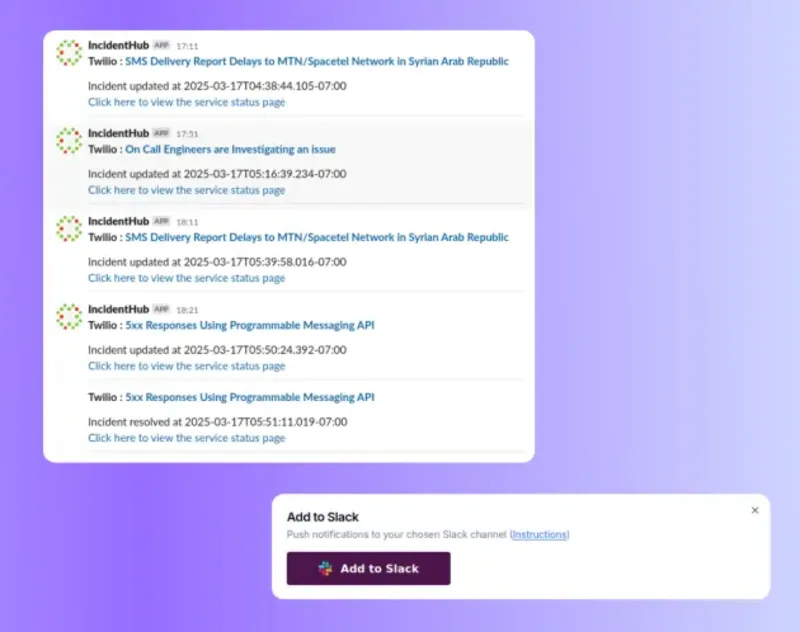
Integrate Your Monitoring System With PagerDuty Using Events API V2
· 4 min read
Hrishikesh Barua
Founder @IncidentHub.cloud

Introduction

PagerDuty's Events API V2 lets you push events from your monitoring systems to PagerDuty. You can send such events when an incident is triggered, updated, or resolved. This article is a short guide on the different options to integrate PagerDuty with your monitoring and alerting systems.

Lifecycle of an Incident

If you are using PagerDuty for on-call management, an incident will typically go through these states:

StateTriggered BySource
TriggeredAutomaticMonitoring system
AcknowledgedOn-call EngineerPagerDuty app/Phone call
UpdatedAutomaticMonitoring system
ResolvedOn-call EngineerPagerDuty app/Phone call

Monitoring Third Party Vendors as an Ops Engineer/SRE

· 3 min read
Hrishikesh Barua
Founder @IncidentHub.cloud

Why should you monitor your third-party Cloud and SaaS vendors if you are in SRE/Ops?

As part of an SRE team, your primary responsibility is ensuring the reliability of your applications. What makes you responsible for monitoring services that you don't even manage? Third-party services are just like yours - with SLAs. And outages happen, affecting you as well as many others who depend on them.

It's a no-brainer that you should know when such outages happen to be on top of things if/when it affects your running applications.

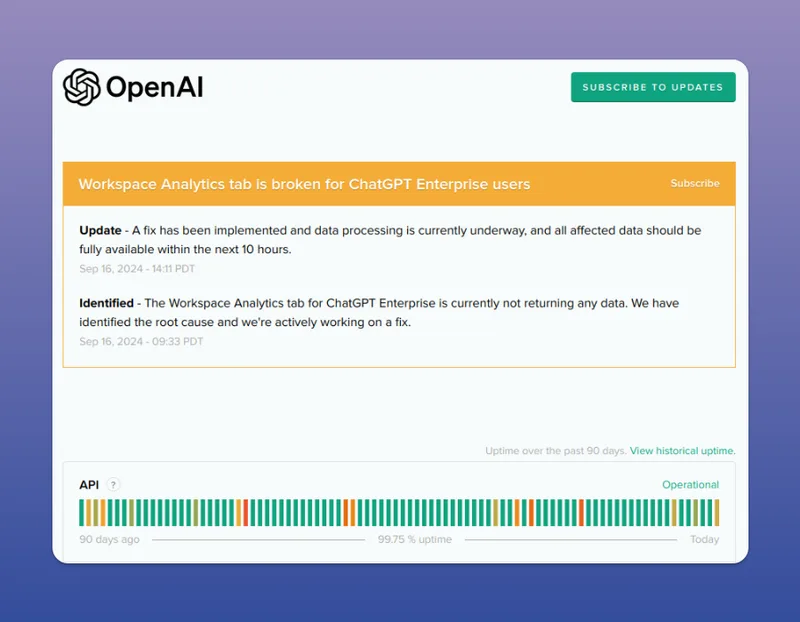
Most of your third party dependencies will have a public status page or a Twitter account where they publish updates on their outages. Here are some seemingly easy ways to monitor these pages

  • Subscribe to the RSS feed of these pages
  • Follow the Twitter account
  • Sign up for Slack, Email, SMS notifications on the status page itself if the page supports these

The Benefits of a Single Incident Management System

· 2 min read
Hrishikesh Barua
Founder @IncidentHub.cloud

How many monitoring tools do you have?

Chances are at least 2-3. One tool usually does not cover all cases, and it’s usually a combination of self-managed and managed tools. Self-managed gives you more control over custom configurations and cost. Managed ones take away the headache of running it yourself.

Prometheus is the de-facto standard for monitoring these days if you have a modern application stack and you want to manage your own monitoring. It is metrics-based, i.e., it uses metrics as the source of data from all the monitored systems. There are ready-made exporters for almost all popular infrastructure components. You can send your application and business metrics to Prometheus too with OpenTelemetry exporters.

This model does not work for all aspects of your service. E.g. If you want to monitor external properties like your website, or use synthetic monitoring to check your customer-facing APIs from global locations, you could use something like Pingdom or UptimeRobot. This becomes another source of data about your service's uptime.

Monitoring Your Third-Party Cloud and SaaS Services is Critical

· 3 min read
Hrishikesh Barua
Founder @IncidentHub.cloud

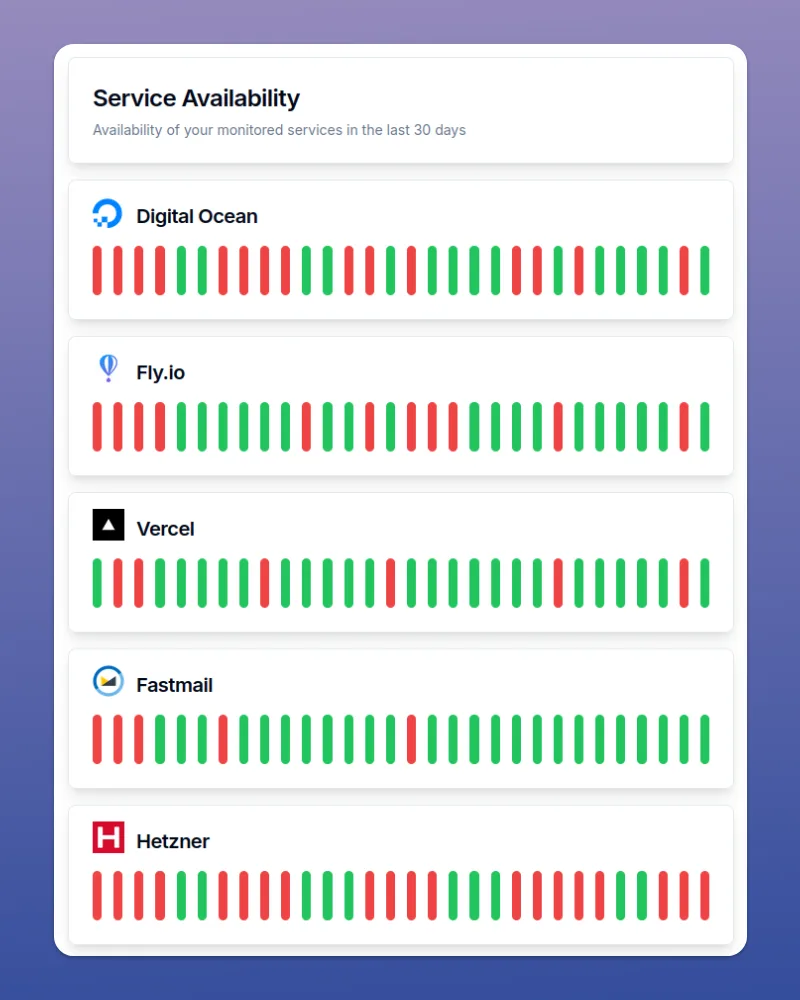
If you have a software-based business, you are using at least a few cloud based tools. It does not matter if you are a solo developer, or part of a 50-member team in a large organization. Take this random list and chances are you are using at least half of them:

Your entire business - irrespective of org or market size - including your development tools, collaboration/communication tools, infrastructure and hosting, monitoring, even email - is dependent on services that you don’t control. They are provided by other vendors.

Of course, you pay for some of them and they all have SLAs. Having an SLA does not translate to 100% uptime. Companies will try their best to meet SLAs - which promise a percentage of uptime (usually 99.xx). There are going to be incidents in your providers at some point, and the effect will cascade to the service that you provide to your customers. This means that your own product's SLA can be breached due to causes outside your control.