How to Monitor SaaS Status in 2026 : A Complete Guide

Introduction
This is an updated and expanded version of the older guide.
According to the 2025 State of SaaS report, organizations use an average of 106 SaaS apps.
Staying on top of your SaaS vendors' status is as important as monitoring your own services. The Cloudflare, AWS, Azure, and Google Cloud outages in 2025 were strong reminders of this fact. As a result of these outages, many SaaS services that depend on them experienced outages as well, leading to a cascading effect which took down hundreds of vendors and affected thousands of users. Cloud and SaaS outages are not isolated any longer but usually happen in groups due to the dependency chain.
This article aims to be a comprehensive guide on how to monitor the uptime status of your SaaS and Cloud vendors.
- Introduction
- Monitoring SaaS and Cloud Vendors' Status
- Manual Monitoring of Public Status Pages
- Running Your Own Status Page Monitor
- Using a Status Page Aggregator
- Key Benefits of Managed Status Page Aggregators
- Status Page Aggregator Best Practices
- Set up Component Filtering
- Fine-tune Alerts by Type
- Fine-tune Alerts by Lifecycle
- Integrate with Your Team's Workflow
- Include Third-party Status in Your Incident Response Plan
- Periodically Review Your Organization's Service Usage
- Make the Aggregated Status Page Easily Accessible
- Enable Upcoming Maintenance Notifications
- Advanced Techniques with a Status Page Aggregator
- Choosing Your Monitoring Approach
- A Status Page Aggregator Implementation Workflow
- Common Status Page Aggregator Implementation Pitfalls
- Non-Status Page Methods
- Conclusion
- FAQ
Monitoring SaaS and Cloud Vendors' Status
There are several ways to monitor SaaS and Cloud vendors' status. The most reliable one is to monitor their public status pages. Status pages remain an important source of truth as they are directly managed by vendors. There are other, supplementary sources of information apart from status pages that you can refer to, but they are neither comprehensive nor always reliable.
We will look at each of them in turn.
If you want a quick way to decide which approach fits your situation, jump to the decision table later in this guide.
How to Monitor Multiple SaaS Status Pages - Quick Overview
To monitor multiple SaaS and cloud service status pages in one place, you have these options:
- Manually check each vendor's public status page (not scalable beyond a few vendors).
- Subscribe to individual email/RSS notifications (no component filtering, fragmented alerts).
- Build and maintain your own status page monitor (high effort, high maintenance).
- Use a status page aggregator that combines multiple status pages into a single view (recommended).
Why Status Pages Remain the Gold Standard
Status pages are directly managed by vendors, and are hence authoritative sources of information. They also have structured, parseable data that can be consumed by automation tools. They remain the contractually significant source for tracking SLAs.
In some cases, vendors may take longer to update their status pages to announce an incident that they are still investigating. This reflects their internal incident response process. While crowdsourced platforms and telemetry data sites may provide early warnings, such sources lack context (which components, regions are affected), accuracy, and official confirmation.
The reason status pages remain essential is because they provide structured incident data, regional and component level details, official timelines for SLAs, and upcoming and ongoing maintenance schedules.
Manual Monitoring of Public Status Pages
Manual monitoring works only at a very small scale and is included here to establish a baseline for comparison.
The first step here is obviously to identify the SaaS and Cloud vendors that you use. Once you have listed them, drill down into the specific services and regions that you use. Note that not all methods we describe in this article support monitoring specific services and regions.
Locate the Public Status Pages
Most third-party services have a publicly available status page. You can usually find the link on their company website or on their support portal. The status page is either directly managed by your SaaS vendor or outsourced to another service like Atlassian Statuspage, Instatus, Hund, StatusCast, StatusHub, etc. Many monitoring and incident management services like Incident.io and BetterStack also have public status pages as part of their observability and incident management products.
Large cloud platforms like Google Cloud, Amazon Web Services, Microsoft Azure, Hetzner etc. have their own status page software.
Understand the Status Page Structure
There is no official standard for status page formats but most of them use a similar layout to present the most important information - the current status - first. Visual appeal, ease of use, reliability, timely and useful information, and accessibility are important considerations for public status pages.
Some status pages segregate ongoing incidents into maintenance and outages. Upcoming maintenances are listed so that users can prepare for them.
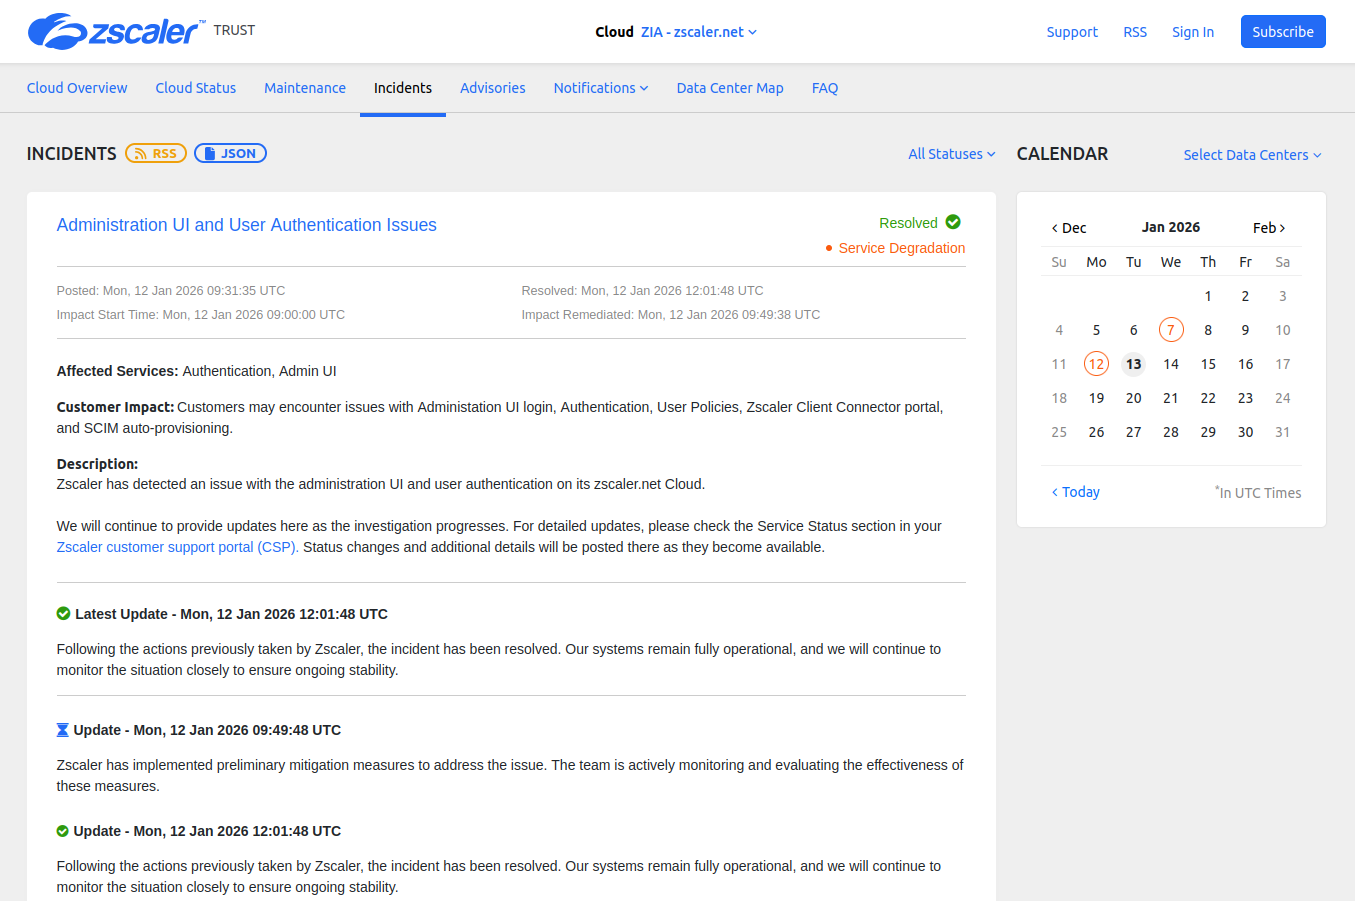
Screenshot from the Zscaler status page.
Common terms used to describe incident states are:
- Investigating
- Identified
- Monitoring
- Resolved
although these can differ from page to page.
Configure Notifications if Available
Periodically visiting status pages to check is not a great practice and is impossible once you start to monitor more than a few. Instead, you can choose to sign up to receive notifications when there is an incident created, updated or resolved. Depending on your provider, status pages offer different modes of notification.
Some status pages have only one or two options, or none at all. E.g. The Salesforce status page has only email notifications:
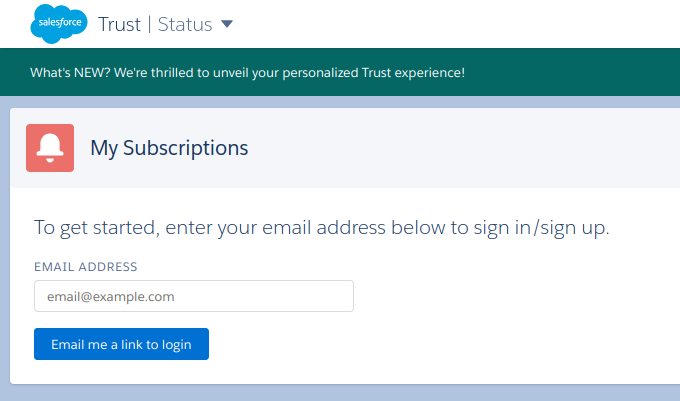
Screenshot from the Salesforce status page.
If the status page is managed by someone other than your cloud provider, your cloud provider can choose to enable/disable some of the available notification options. For an example, both OneWelcome and Ongoing use Atlassian Statuspage but the notification options (as of this writing) are different.
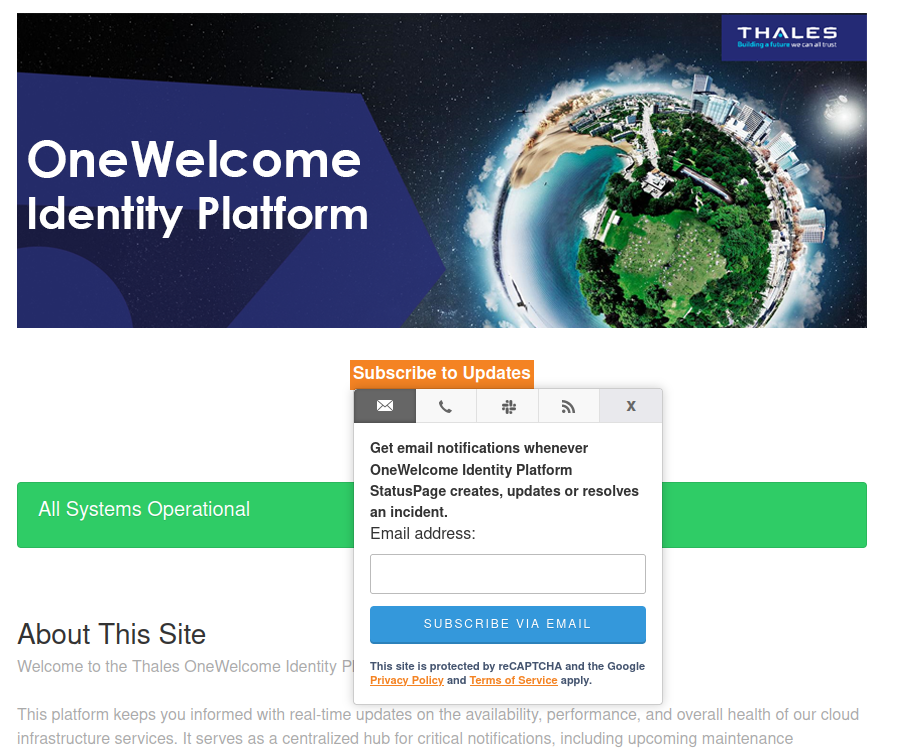
Screenshot from the OneWelcome status page.
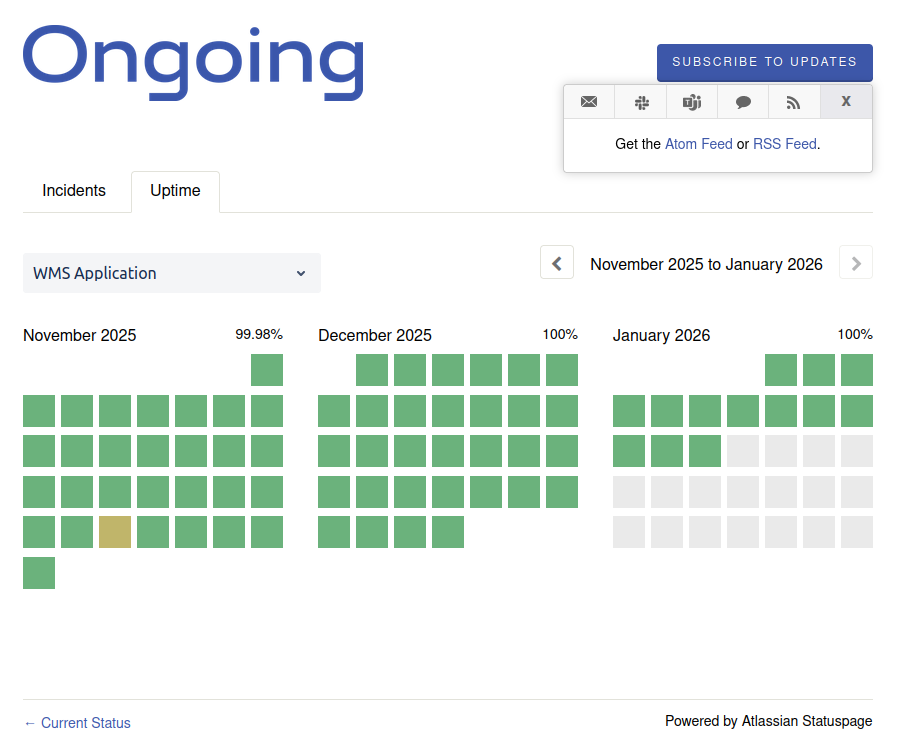
Screenshot from the Ongoing status page.
Notification Challenges
Your notifications should be delivered in a way that ensures the right team receives the alerts. To be able to make it part of your team's workflow, the status page should support the notification channels that your team uses. Your vendor status pages won't have homogeneous notification options, which becomes an obvious hurdle here. They might not offer the option you need. See the section on Using a Status Page Aggregator on how to mitigate this.
Also, there is no way to test these notifications until the next outage happens.
If you are manually monitoring status pages, you can check if the status page supports filtering by components and regions. If it does, use it so that your team is not flooded with unnecessary notifications.
Subscribing to Status Page RSS Feeds
Some vendor status pages have RSS feeds that you can subscribe to. You can pipe the RSS feed into your Slack, Discord, or MS Teams channel. While this gives you a good way of getting outage information directly from the vendor, it has several drawbacks:
- Not all status pages have RSS feeds.
- This approach lacks any filtering for components and regions. You will end up receiving every single outage and maintenance notification.
- There is no way to search through historical data easily or look at ongoing incidents and maintenance.
- There is no single view of all your services in a single place. The alerts will be in your Slack or Discord or MS Teams channel.
- Some RSS feeds won't notify you when an incident is resolved.
- This approach can break easily when your vendor changes status page providers as the RSS feed URL might change or get removed completely. Your team would stop receiving notifications and would not know about it until it's too late.
In short, subscribing to RSS feeds does not hold up as a solution for staying on top of outages both because of the sheer variety of status pages that are out there and also because of the limitations of the RSS feeds themselves.
Running Your Own Status Page Monitor
There are some open source tools that attempt to monitor third party status pages. However, they are not full-fledged solutions.
- statusphere : This is not being actively developed. As of this writing the last commit was in 2024.
- status-page-aggregator : According to the README, it is a "A production-ready status monitoring dashboard that SRE teams can fork and customize for their specific vendor dependencies." However, it lacks out of the box notification support except for email. There is also no way to choose specific vendors to monitor.
- statusy : This repository is also archived and not being developed any longer.
Such tools may not support all the services or features you need. There is also no guarantee of them being bug-free, or of getting support when you need it. Hosting your own monitor from an open source project has almost the same level of effort as developing and maintaining your own in-house tool. That comes with its own challenges of engineering cost, maintenance, new service support, reliability, and uptime. In addition, there are technical challenges in maintaining such a tool:
- Some status pages without any RSS feed or APIs need to be scraped. HTML scraping can easily break when the status page layout changes.
- Many status pages have CAPTCHA/bot protection to prevent abusive behavior. If your status page monitor tool does not have the correct logic to prevent such behavior, it can easily get blocked from further data collection.
- All status page providers enforce rate limiting for API requests. If your tool does not respect these limits, it will be blocked from further API calls.
- Vendors moving to new status page providers can break your status page parsing as the API endpoints will change.
Using a Status Page Aggregator
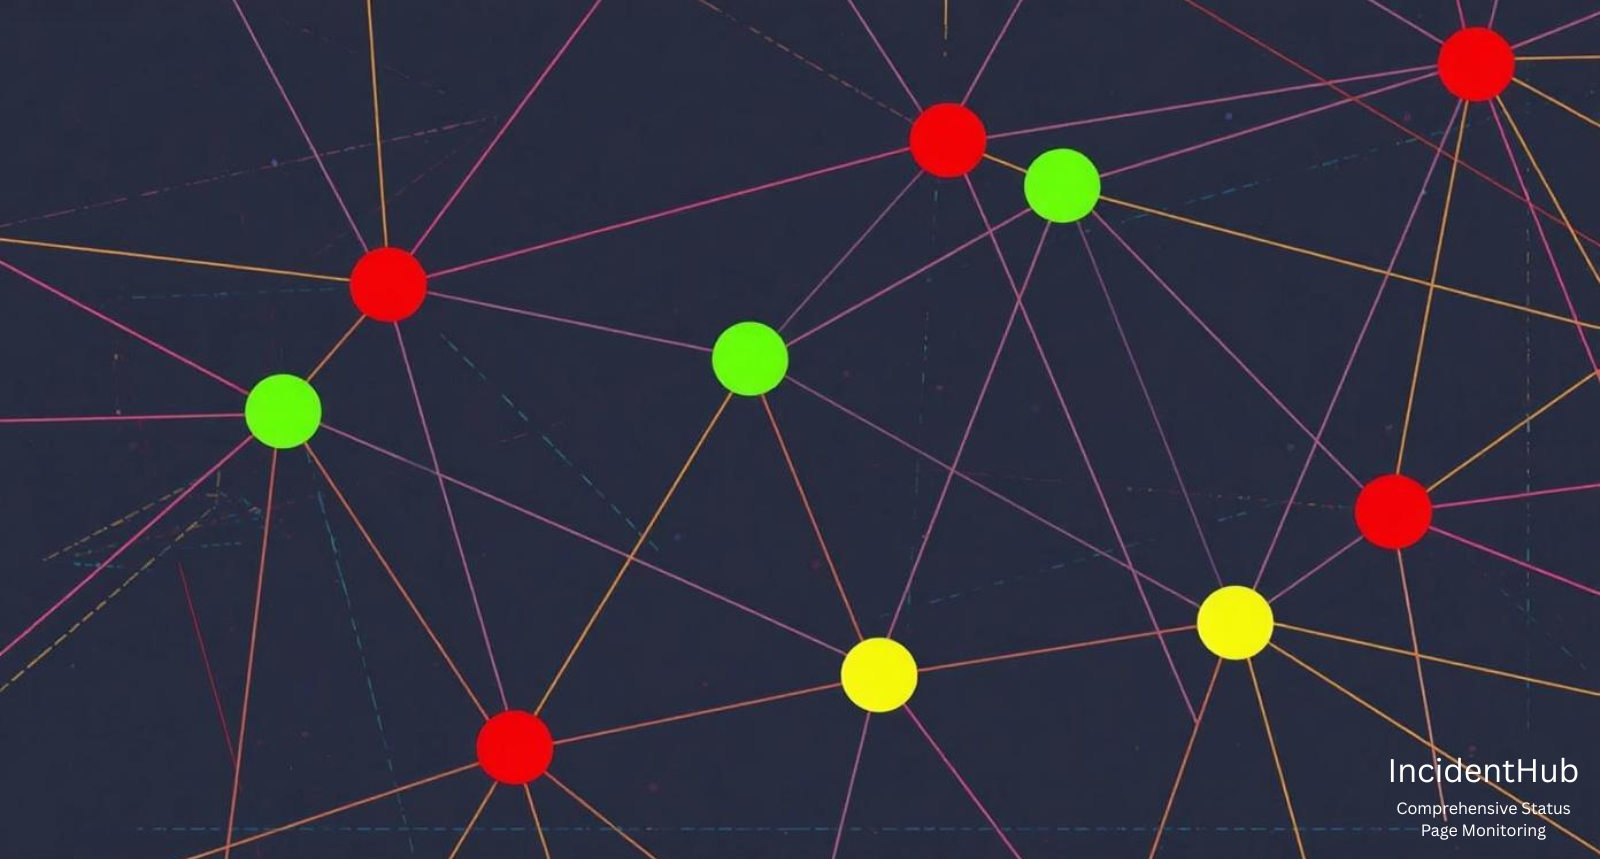
A status page aggregator periodically tracks multiple status pages and centralizes third-party dependency status in one page. It presents a single status page for multiple other status pages by combining and normalizing data from them. The data is fetched using different methods including RSS feeds, APIs, scraping, and webhooks.
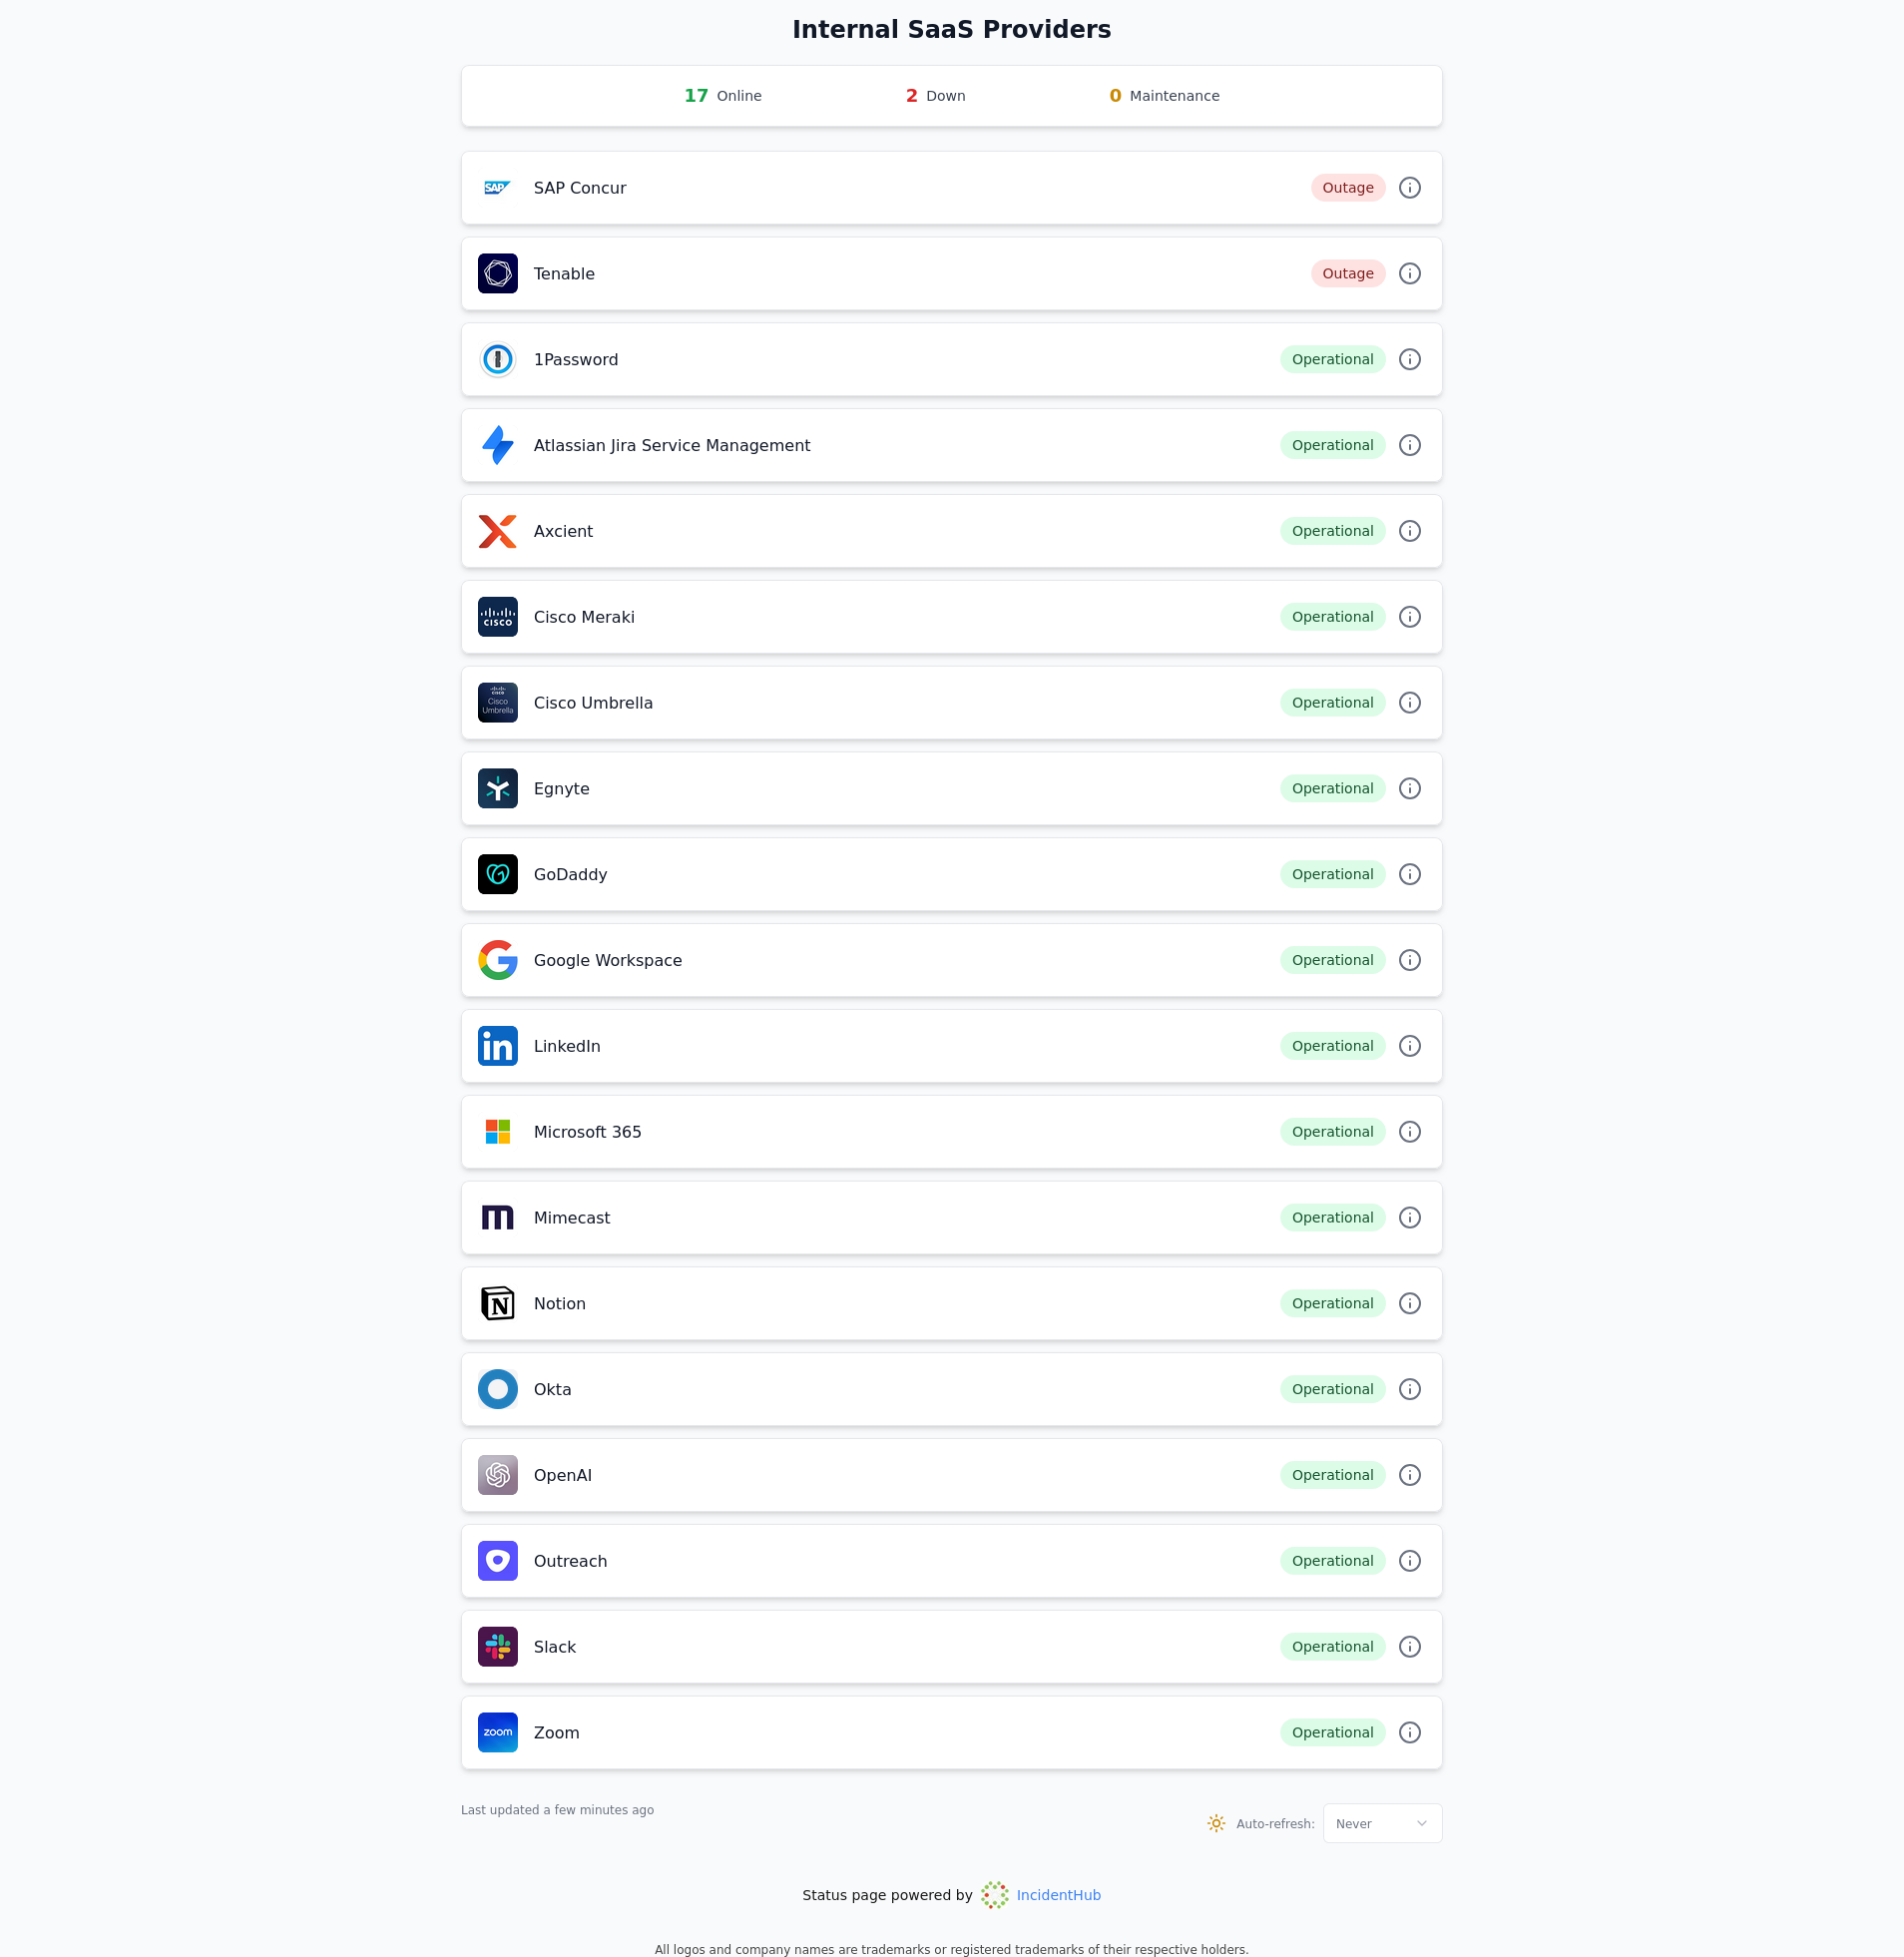
Screenshot from an IncidentHub public status page.
IncidentHub is a status page aggregator built specifically for monitoring third-party SaaS and Cloud status pages.
Key Benefits of Managed Status Page Aggregators
A managed status page aggregator:
- Normalizes external data sources (status pages, APIs, RSS feeds, webhooks) that differ in format and terminology.
- Gives you one status page for multiple other status pages.
- Adapts to changing status page formats, URLs, and providers.
- Supports advanced alert filtering and notification options not available on the status page.
- Lets you analyze historical data and availability trends.
- Supports multiple users and teams which is useful for large organizations.
Status Page Aggregator Best Practices
Set up Component Filtering
An outage alert is relevant only if it directly affects your business in some way. Instead of receiving alerts for each and every incident from a vendor, you can select the specific components that your organization actually uses. This prevents alert fatigue and keeps your notifications relevant.
ℹ️ Real World Alerting Insights
- Cloudflare, Salesforce, Amazon Web Services, and Google Cloud Platform are among the services where almost all users set up component filters.
- Google Cloud Platform has more than 8000 region-service combinations.
- Slack is the most popular channel (56%), followed by Email (24.7%), for vendor alerts.
Source: IncidentHub monitoring data
Fine-tune Alerts by Type
You can further fine-tune alerts by type. You can set up your status page aggregator to send notifications only for outages, only for maintenances, or for both. E.g. For some services like Twilio, there are a ton of maintenance events which might not be relevant for your needs even if they are filtered by component.
Fine-tune Alerts by Lifecycle
Some third-party services are more critical than others for your business. You would want to closely follow every outage update for those until it is resolved. For not so critical services, it is okay to receive alerts only when the outage start and ends. Some status page aggregators let you toggle this.
💡 Which Settings Should I Choose for Alerts?
Too many settings can be overwhelming.
Start with the basics - which components do you need to monitor? Set up component filters for those. This is the bare minimum.
Once you have that, decide which types of alerts you need - maintenance updates, outage updates, or both? If neither and you just need an aggregated status page, turn off both. The single status page reflects your component filters also.
After this, you can choose to fine-tune further at the lifecycle level - when do you want to be notified - when the outage starts, when it ends, or for all updates? This makes sense if you have categorized your services by criticality. If not, skip this.
At each stage, you can decide if you wish to go to the next stage of fine-tuning.
Integrate with Your Team's Workflow
The easiest way to onboard a new tool is to integrate it with your team's existing processes. A status page aggregator can send notifications to whatever your team uses - Slack, Discord, Email, Microsoft Teams, etc. to stay ahead of outages.
Include Third-party Status in Your Incident Response Plan
Including third-party service status in your incident response plan helps correlate alerts from your own systems with alerts from third-party services. This can help your team triage incidents faster. E.g. when you receive an alert for your payment processing microservice that talks to Stripe, you can quickly check Stripe's status and rule out external issues.
Periodically Review Your Organization's Service Usage
You can do this as part of your incident response plan review. Your organization may start using new services, stop using existing ones, or start using new services on the same vendor's platform. This should be reviewed periodically to ensure that your status page aggregator's monitored services are in sync with your organization's usage.
Make the Aggregated Status Page Easily Accessible
A centralized status page with all your services and vendors' status gives you at-a-glance visibility into the status of your third-party dependencies. You can display it on a large screen TV or monitor in your office. Many NOC teams do this. This can help your team stay on top of outages easily even if you have alerts enabled.
Enable Upcoming Maintenance Notifications
Some status page aggregators let you enable upcoming maintenance notifications so that your team can prepare for them. This can avoid last-minute surprises when the maintenance is about to start.
Advanced Techniques with a Status Page Aggregator
Automate Ticket Creation
Your customer support team can respond proactively to customer inquiries about outages in your products if they are aware of third-party outages that might be the root cause. If your status page aggregator integrates with platforms like Zendesk, it can automatically create tickets there and keep your support team informed.
Setup Multiple Teams
In larger organizations, different teams may have different third-party dependencies. They may use different services, or different components from the same service. The alerting needs may also be different - with each team being in, say, a different Slack channel. Such cases are best handled by creating multiple teams and segregating the aggregate status pages and alerts by team. Each team can also be managed by different admins and include different team members. This way, services, alerts and status page remain separated by team, while the overall data and settings remain under a single organization account.
📘 Real World Example - Multiple Teams at a FinTech Company
A FinTech company wanted to monitor their third-party dependencies which included cloud providers, financial services providers, hosted databases, payment gateways, and other SaaS services.
The company had multiple teams - Data Platform, Infrastructure, Security. Each team wanted third-party vendor outage alerts in a separate Slack channel. The key cloud providers were AWS and Cloudflare.
The Data Platform team wanted to monitor Elasticsearch and Amazon RDS, whereas the Infrastructure team wanted to monitor Amazon S3, EC2, and other infrastructure related services.
This need was best met by creating teams - where each team in the status page aggregator mapped to an organization team. Each team ended up with:
- An independent list of monitored services with their own component filters and alert filters.
- Their own aggregated status page, customized with their team's title.
- Integration with their own Slack channel.
The overall account remained under the control of an organization-level admin.
Source: IncidentHub customer case study
Advanced status page aggregators support this by letting you setup multiple teams and individual status pages and alerts channels for each.
Custom Integration Using APIs and Webhooks
If you have custom-developed or legacy tools for alert notifications, or have a custom dashboard for incident management, the standard integrations in a status page aggregator may not be enough. You can use the aggregator's APIs and webhooks instead to push the outage and maintenance updates to your tool/dashboard.
This preserves a seamless experience for your team where they continue to use their existing tools and can see their third-party dependencies' status in the same place.
Historical Trend Analysis
You can track historical data for your dependencies to see how often they go down and identify patterns. This can also help you to:
- Validate SLA commitments for contract renewals.
- Make data-driven decisions when you select vendors.
- Identify services that are unreliable but critical and justify backup vendors for redundancy.
ℹ️ 2025 Cloud and SaaS Outage Statistics
- SaaS and Cloud outages were the highest in September, October, and November 2025. A lot of this was due to the cascading effect of the Cloudflare, Azure, and AWS outages.
- IncidentHub detected more than 48k outages in 2025 across hundreds of SaaS and Cloud services.
- Cloud and hosting provider outages accounted for around 22% of the total detected outages. This seemingly low percentage compared to others is because many SaaS services depend on these cloud and hosting providers for their infrastructure.
Source: IncidentHub monitoring data
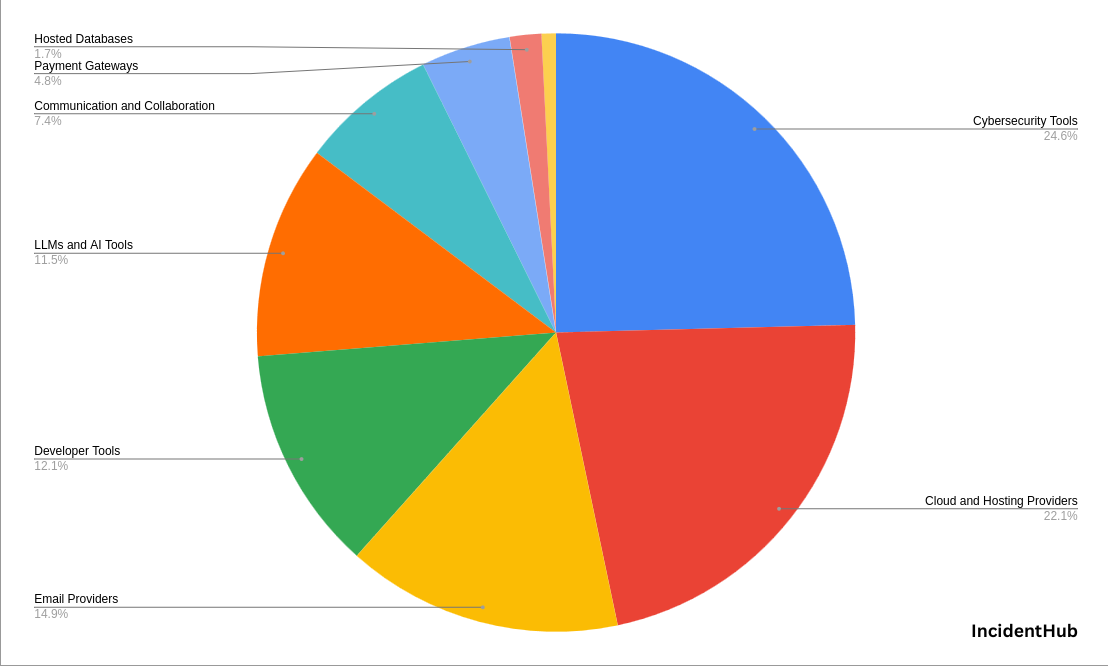
Data source: IncidentHub monitoring
Choosing Your Monitoring Approach
Your approach depends largely on your scale and needs. However, given that most teams today - irrespective of size - depend on third-party services, a status page aggregator is usually a hassle-free option. It can scale with your needs.
If your needs are really simple, then you may not need an aggregator - e.g., if:
- You have one or two third-party dependencies.
- All your status pages allow you to filter by components.
- All your status pages support your alerting channels.
- You are not interested in seeing an overall status page for all your status pages, and alerts in email/Slack/Discord are enough.
- You don't need to fine-tune alerts by type and lifecycle.
- No need for historical trend analysis.
Decision Table
| Your Situation | Recommended Approach |
|---|---|
| 1-2 vendors, all have filtering and support your notification channel | Manual monitoring |
| 3-5 vendors, mixed notification support | Consider aggregator |
| 6+ vendors | Status page aggregator |
| Need historical analysis for any vendor count | Status page aggregator |
| Multiple teams with different dependencies | Status page aggregator |
| Need single status page view | Status page aggregator |
| Vendor status pages keep changing | Status page aggregator |
| Need fine-tuning of alerts by type and lifecycle | Status page aggregator |
A Status Page Aggregator Implementation Workflow
A typical workflow for integrating a status page aggregator into your organization would have the high-level steps outlined below.
Implementation Workflow Overview
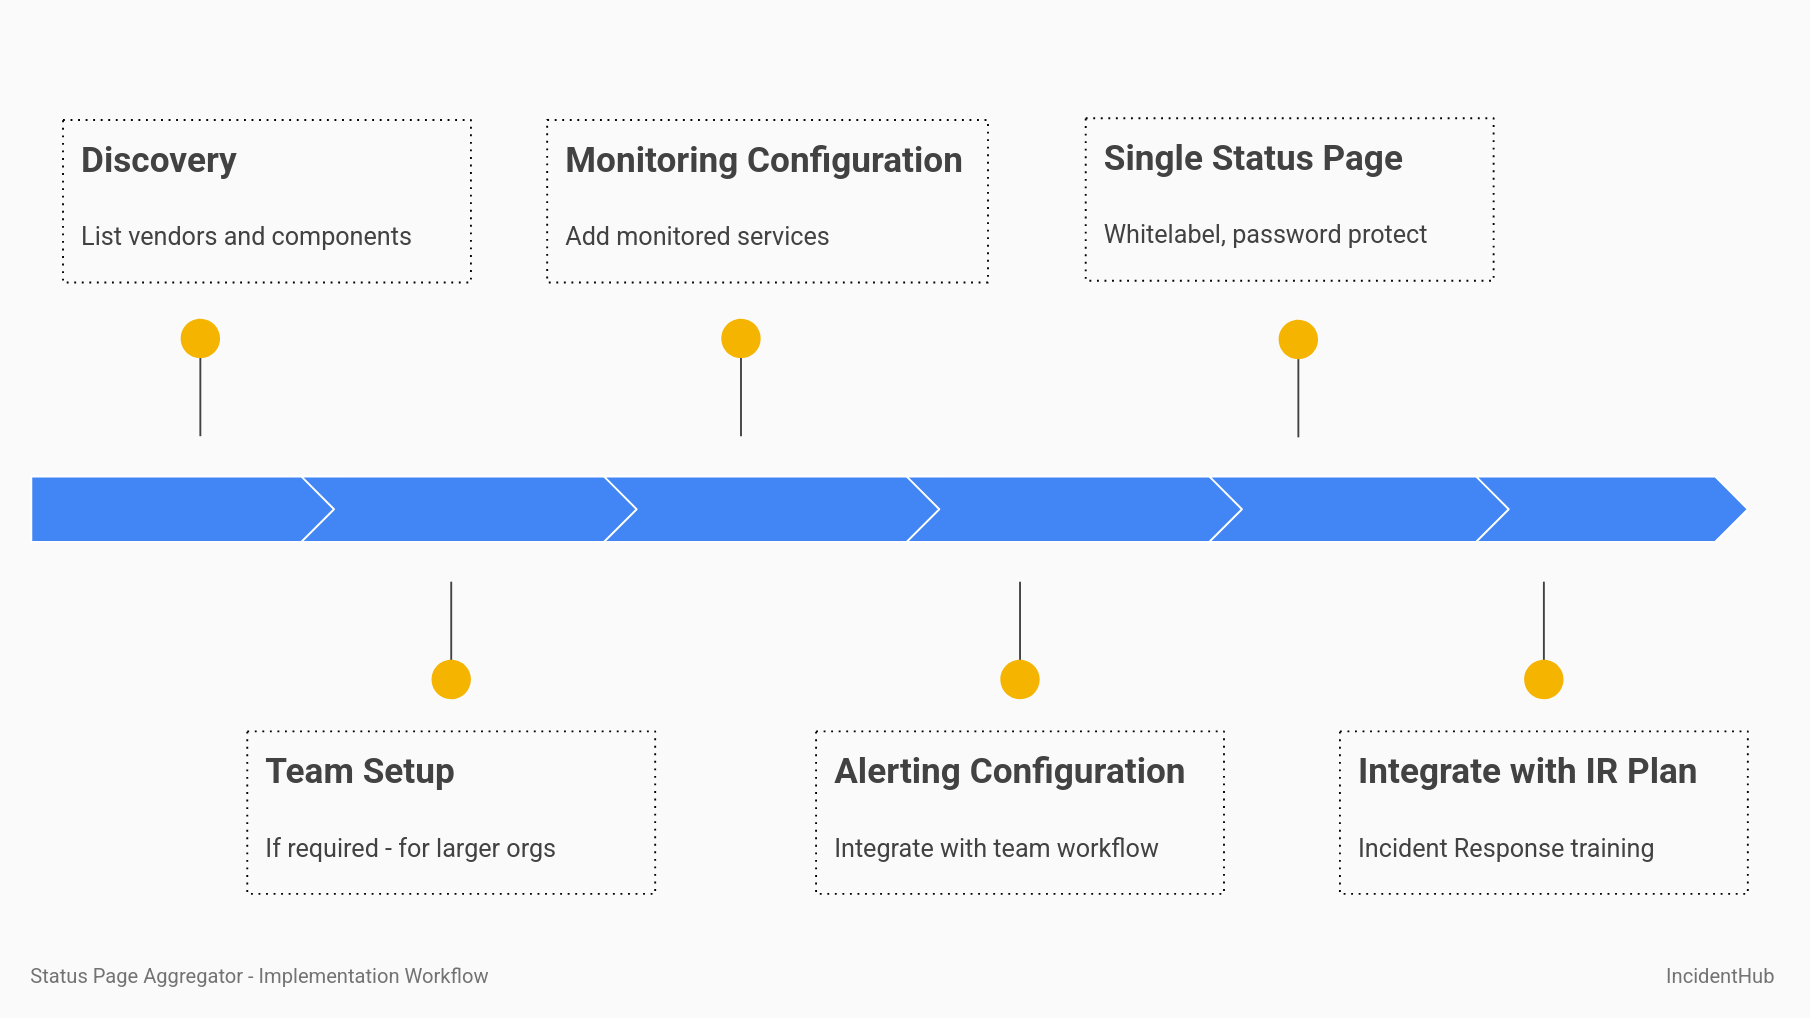
Status Page Aggregator Implementation Workflow diagram
Discovery
List down your third party services and their components/regions that you use. If you have multiple teams, you need to do this separately for each team. If you have different levels of criticality for your services, you need to categorize them accordingly. These settings will be used to configure the alerts later - see the sections Component filtering, Fine-tune Alerts by Type, and Fine-tune Alerts by Lifecycle.
If you have services with a lot of components (e.g. like Cloudflare, Google Cloud Platform, etc), you can directly configure the aggregator instead of listing them down first. It is helpful, however, to have the list of vendors in one place. You may be able to get the vendor list from your compliance or security team. For smaller organizations, you might have to compile this yourself. Other sources can be:
- Billing and procurement systems.
- IT asset inventory.
- Team surveys.
Team Setup
Create individual teams in the aggregatorif you have more than one team and each team has different needs for dependencies and alerting. Each team can have one or more admins and team members if the aggregator supports it.
Monitoring Configuration
If you have multiple teams, add the monitored services and components/regions for each team in the status page aggregator. You can further fine-tune the alert types if required. For a single team, the setup is much simpler.
Alerting Configuration
Integrate the alerts with your team's existing tools - Slack, Discord, Email, Microsoft Teams, etc. Some status page aggregators like IncidentHub let you send a test message to ensure that your integration is working fine.
A Single Status Page for Many Status Pages
Set up the single status page, or one for each team (if you have multiple teams). This will be the single point of truth for your team to see the status of all their services. Depending on the status page aggregator, you can whitelabel the status page with your own logo, brand colors, custom domain, and other branding elements. You can also add a password to the status page to prevent unauthorized access.
Integration Into Incident Response Plan
Include third-party status monitoring in your incident response plan. Your on-call engineers should be able to access and understand the aggregated status page and the alerts. Make this a part of your on-call training and awareness programs.
Common Status Page Aggregator Implementation Pitfalls
Here are some common pitfalls to avoid.
Starting With Too Broad Settings
Enabling all alerts can overwhelm your team and easily lead to a state where they start to ignore alerts. Choose your filters and other settings carefully so that you are not flooded with unnecessary alerts. It might take a few iterations to get this right.
Accessibility and Visibility
The on-call teams, developers, Ops and IT teams should be able to use this information to triage ongoing outages. The dashboard and alert channels should be easily accessible and visible.
Stale List of Monitored Services
Services, regions, vendors get added/removed/changed frequently. The list of monitored services should be updated regularly to avoid stale information as part of your incident response plan reviews.
Non-Status Page Methods
These methods are included here for completeness. They are not as comprehensive as the status page monitoring approaches and are not recommended for serious use cases.
Using Third Party Telemetry Data Sites
DataDog, the observability and monitoring platform, recently announced a site called updog.ai. It curates data from DataDog's own customers who monitor their infrastructure using DataDog. While this can be a limited early warning system, it does not suffice as a comprehensive monitoring solution:
- It is limited to the vendors that DataDog's customers monitor. E.g. cloud vendors like AWS are present, but IT management software like Kaseya are not. This is understandable as the data mostly comes from users who use cloud and SaaS services to run their applications. As a user you have no control over the telemetry - which is necessarily constrained by which services, regions, or components of a given cloud service DataDog's customers monitor.
- There is no way to monitor specific services and regions and view them on a single dashboard. E.g., you can filter AWS services but you have to visit each service's page on the Updog website to see its status.
- There is no way to receive notifications from the Updog website when a service is down.
Using Crowdsourced Information Sites
There are numerous sites like Downdetector which rely on user reports to aggregate information about service outages. By definition, outage reports on such sites are not comprehensive and neither do they provide a holistic view of the outage:
- User reports can have false positives. E.g. ISP issues interpreted as service outages.
- If users don't report an outage for a specific region, or a service, that's a gap in the coverage.
Such sites also do not provide a way to receive notifications when a service is down, or let you create your own single status page.
Using Social Media
Social media like X, Bluesky, Mastodon, Reddit, Hacker News etc. are the first place people often check for outage reports or post asking for information. Such reports can be helpful to know that something might be off with a service, but they cannot be relied upon for the same reasons as the previous point about crowdsourced information.
Some services have an official social media account, but most don't. For example, Microsoft 365 has an official X account where they announce service outages.
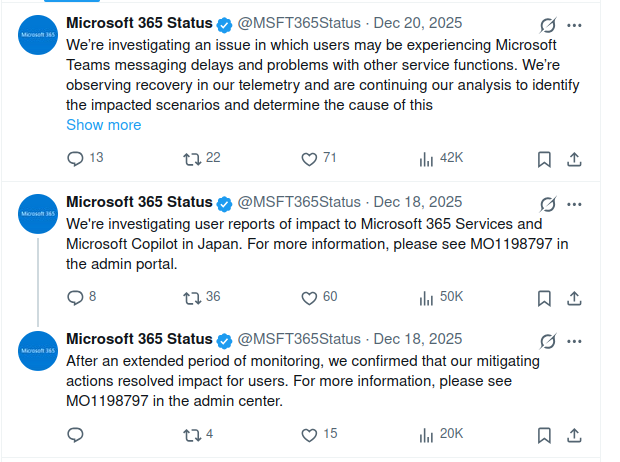
Screenshot from the Microsoft 365 status account on X.
Conclusion
2025 saw a number of major cloud outages, especially in the infrastructure layer, demonstrating the impact that a few providers can have on other services and users. It is more critical than ever to monitor your third-party dependencies' status. A managed status page aggregator is the most comprehensive way to do this.
FAQ
How do I monitor multiple status pages at once?
You can monitor multiple status pages at once by using a status page aggregator.
Should I monitor internal tools like Slack, Jira, or Asana?
Yes. Outages in these tools can disrupt team communication and collaboration, and ultimately affect your business.
How do I prevent alert fatigue from status pages?
You can prevent alert fatigue from status pages by configuring your status page aggregator to send alerts only for the components and regions that you need to monitor.
How do I know which components to monitor for each vendor?
Start with what you know that you use. For cloud providers, check your infrastructure configuration which AWS services appear in your console and which regions host your resources. For SaaS platforms, review which features your team actively uses. When in doubt, monitor broader categories initially, then narrow down as you understand it more.
Can I monitor the same vendor for different teams with different needs using a status page aggregator?
Yes. For example, your infrastructure team would want to monitor AWS EC2, while your Data Platform team would want to monitor AWS RDS.
What if a vendor doesn't have a public status page?
Some smaller vendors don't maintain public status pages. For critical vendors without public status pages, this should be a consideration during vendor evaluation. You can request they implement one, or you'll need to rely on direct support channels during incidents.
What happens when my vendor changes status page providers?
With manual monitoring, you will need to track such changes and reconfigure everything. A managed aggregator handles these transitions automatically and you will not lose any monitoring coverage.
Should I monitor maintenance windows?
Yes, especially for critical services. Knowing about scheduled maintenance helps you plan around potential disruptions to your customers and users. For non-critical services where maintenance doesn't impact your customers and users, you can disable maintenance notifications.
Can I monitor vendors that don't use standard status page platforms?
Yes. Modern status page aggregators can monitor various formats - RSS feeds, custom status pages, API endpoints, and also standard platforms like Atlassian Statuspage. The aggregator handles the complexity of different formats and presents everything in a consistent view.
My vendor had an incident but I didn't receive an alert. What happened?
Check if the incident affected components or regions you're monitoring. Many incidents are isolated to specific features or geographic regions. If it affected something you use, verify your component filters and notification settings are configured correctly.
IncidentHub is not affiliated with any of the services and vendors mentioned in this article. All logos and company names are trademarks or registered trademarks of their respective holders
This article was first published on the IncidentHub blog.