The IncidentHub Blog
Notes on vendor reliability, outages, and status monitoring from the IncidentHub team.
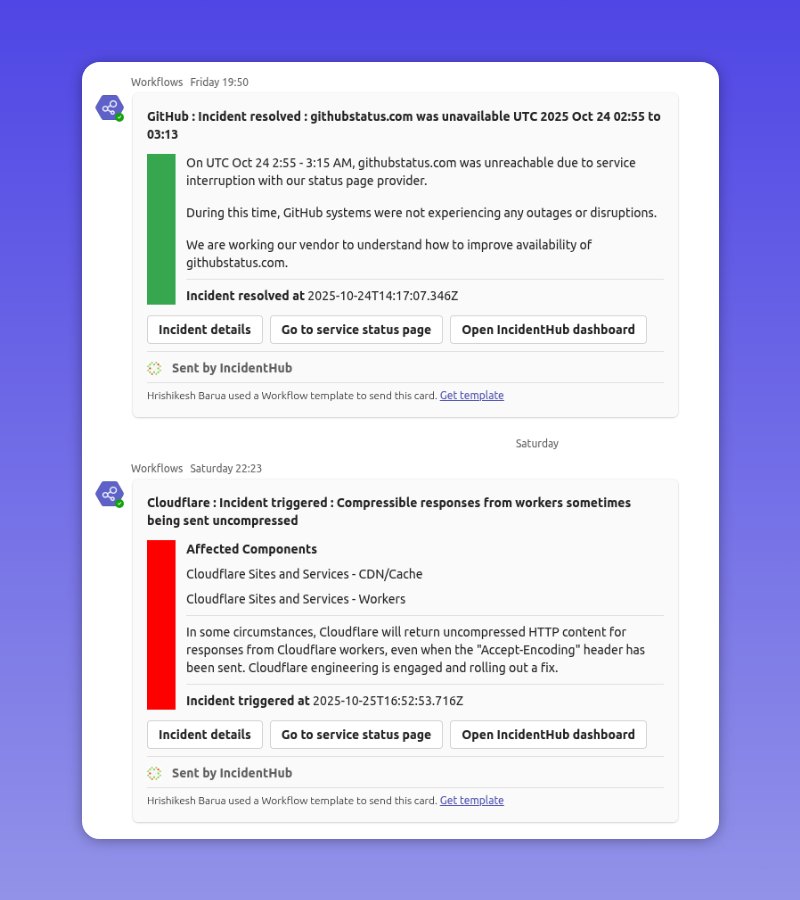
Product Update - Turn Off Alerts, Use Microsoft Teams, and Custom Domains
The 2025 Guide to Open Source Status Page Software

Improving the Developer Experience by Monitoring Third-Party Outages

The Ultimate Guide to Incident Management Tools in 2025
Mistakes To Avoid With Your Public Status Page

Best Practices for Planning for Upcoming Cloud Maintenance
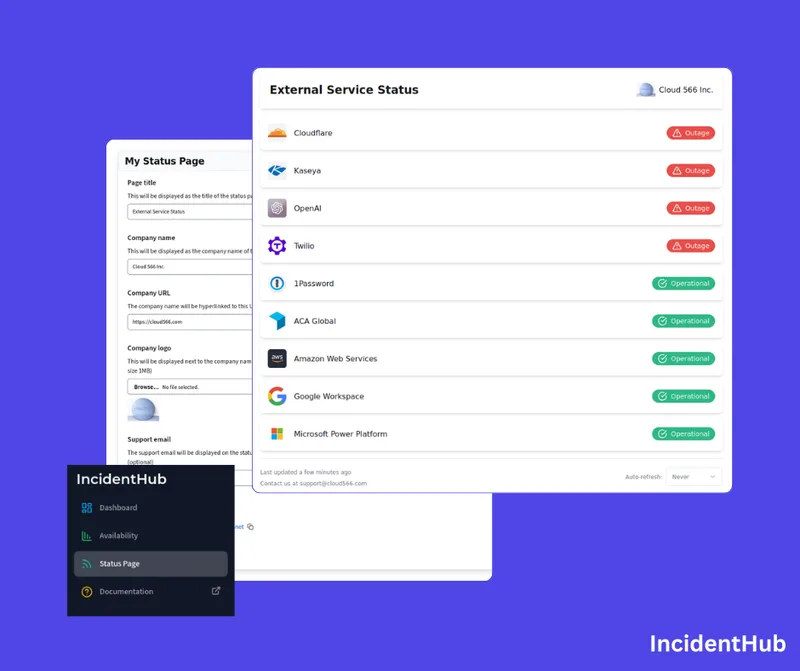
Product Update - Public Status Pages
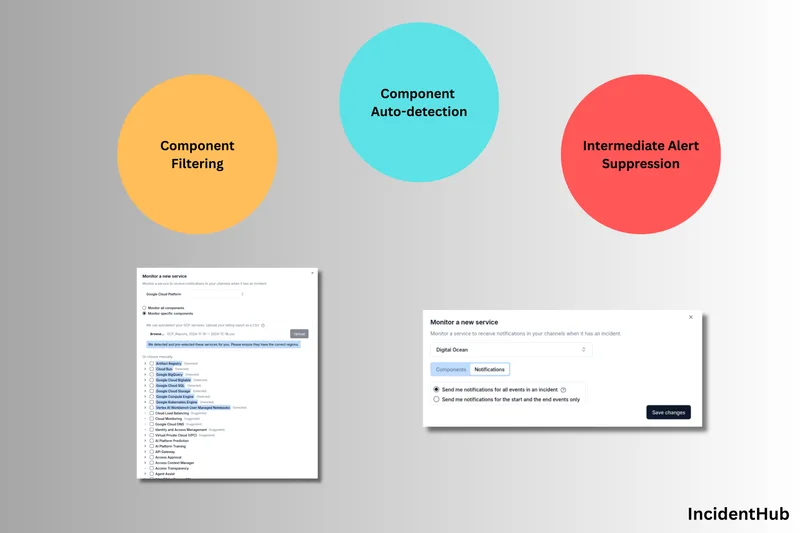
How to Fine Tune Your IncidentHub Alerts
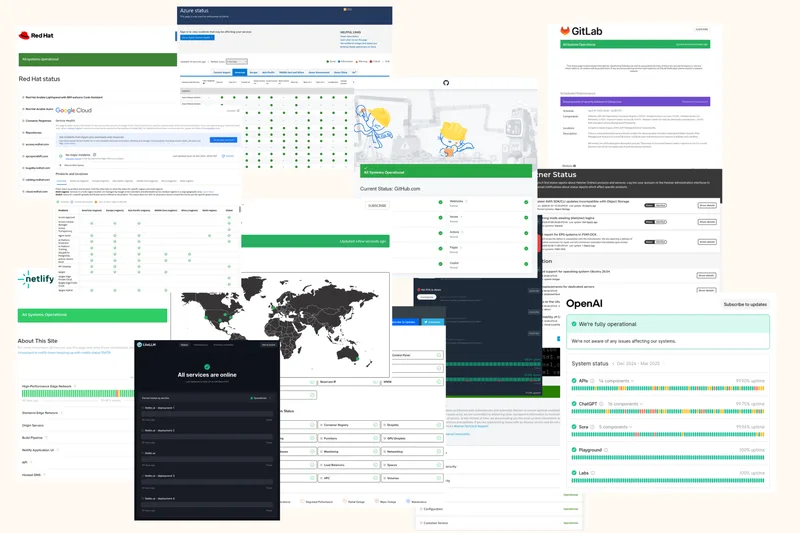
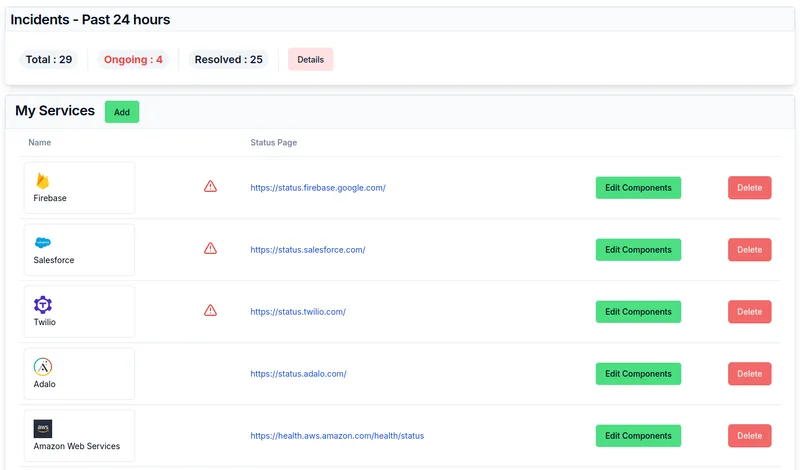
Top 6 Reasons Why You Need a Status Page Aggregator

How to Receive IncidentHub Alerts in your Webhook
January 2025 Product Update - Easier Onboarding, Better User Experience, and Reliability Improvements
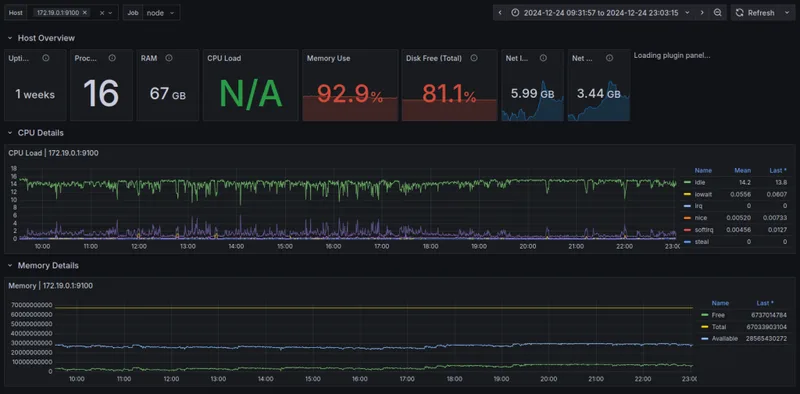
Adding a Grafana Dashboard to Your Prometheus Setup

How To Decide Between Hosting Your Own Status Page Versus Using a Managed One

Monitoring Security Vulnerabilities in Your Cloud Vendors