The IncidentHub Blog
This is the official blog of IncidentHub - the status page aggregator.
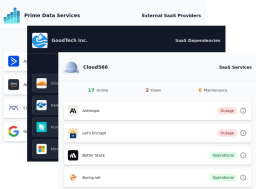
Vendor Outage Monitoring for MSPs: Per-Client Status Pages and Custom Dashboards

Product Update - June 2026

Product Update - May 2026
GitHub Outages 2025 - 2026: Reliability Analysis and Outage History

Why IncidentHub's Alerting is Better than Other Status Page Aggregators'

Product Update - March 2026

The Definitive AWS Outage Report 2025: Reliability Analytics and Cascade Impact
How to Monitor SaaS Status in 2026 : A Complete Guide
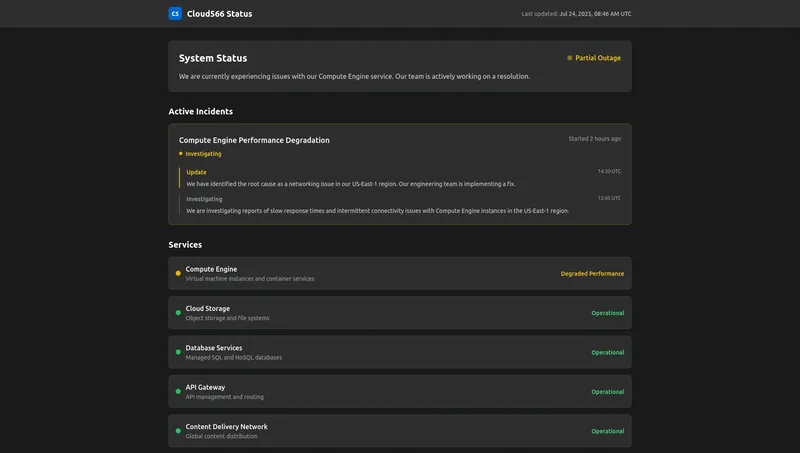
Major Cloud Outages of 2025

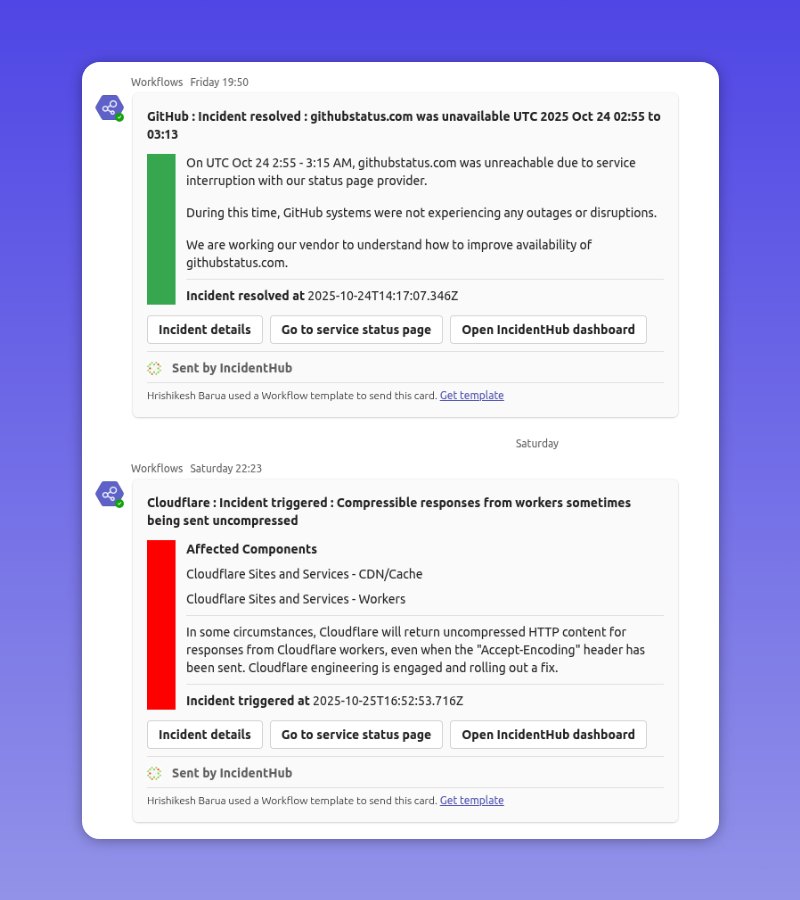
How to Receive Cloud Outage Alerts in Microsoft Teams
Product Update - Turn Off Alerts, Use Microsoft Teams, and Custom Domains
The 2025 Guide to Open Source Status Page Software

Improving the Developer Experience by Monitoring Third-Party Outages

The Ultimate Guide to Incident Management Tools in 2025