Vendor Outage Monitoring for MSPs: Per-Client Status Pages and Custom Dashboards

Introduction
Handling client calls when a third-party vendor has an outage - this will sound familiar if you are a managed service provider (MSP). Your first instinct would be to check if the vendor's status page or social media handle shows anything, or check crowdsourced websites like Downdetector. Or even ask your client to check themselves.
These approaches do not scale when you have more than a few clients, many vendor status pages to check, and clients with different stacks. Public status pages do not always show your client specific issues (e.g. Microsoft 365, Microsoft Azure). Crowdsourced websites can have false positives, and you are delegating something that you should have handled yourself to a third-party website.
This article is about two different strategies you can use to close the gap. Both give your clients an automatically updated status view of the third-party SaaS and Cloud services they depend on, with data gathered from official sources, under your brand. One is a hosted, white-labeled status page you switch on and never have to build. The other is a dashboard you build yourself on top of a live data feed. Which one fits your situation depends on whether you have developers and what you've already got running.
- Introduction
- What Clients Actually Need To See During a Vendor Outage
- One MSP. Many Clients. Many Stacks.
- Two Ways To Give Each Client a Scoped View
- Decision Table
- Where Else Can the Signal Go?
- What This Doesn't Solve
- Where To Start
- Conclusion
What Clients Actually Need To See During a Vendor Outage
When a client reports that something is broken, they're asking two questions - Is it the vendor or is it us - meaning you, the MSP. And if it's the vendor, are you already on it? A good answer can settle both questions quickly and comes from somewhere they trust, which is again you.
Crowdsourced websites are the default go-to sites for a lot of teams, and they have their uses: they are an easily accessible source for information on whether a problem is widespread or localized to a few users. However, they collect user reports only, and are not linked to official vendor sources. A spike in reports in such websites is a signal that something might be wrong. The problem may not even be with the service but with the users' ISP - in which case you are seeing a false positive. It doesn't tell you that Xero has acknowledged an outage or that Microsoft has opened an advisory for Exchange Online. The official status pages have this information, but there we have a caveat.
Services like Microsoft Azure and Microsoft 365 do not update their public status pages for outages affecting specific tenants only. The latter data are available only on the Service Health Dashboard in your Microsoft account. Your clients most likely won't have access to it.
Also, crowdsourced outage report websites are a consumer brand. As an MSP, when you send a client there, you've handed them a possible answer through a third party and put someone else's logo in front of your client instead of yours.
The initial gap thus is about ensuring the client gets accurate information directly from the vendor. That information can come from the vendor's status page, or from their internal health APIs, and it should also be scoped to only the services that the client actually uses. The points below are about meeting this goal without opening 30-40 browser tabs with status pages.
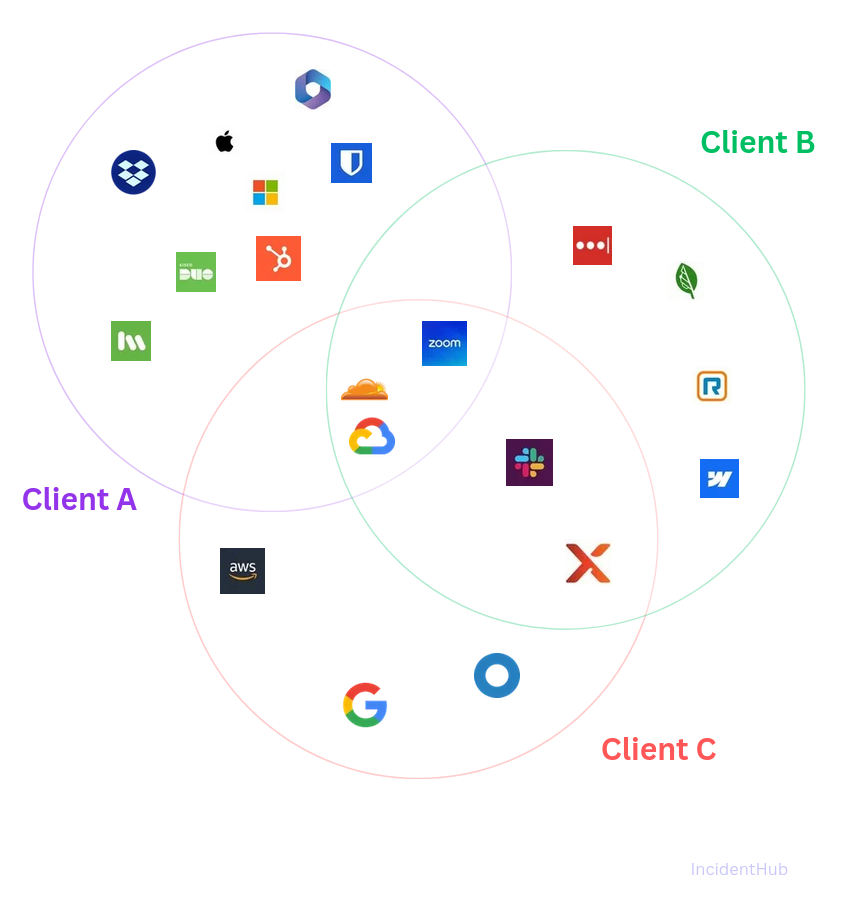
One MSP. Many Clients. Many Stacks.
No two clients have the same stack although there can be overlap between services. One client can run Xero for accounting, Microsoft Teams for team communication, Azure for cloud workloads, whereas another can use MYOB, Slack, and Google Cloud.
So even if you had a hypothetical single dashboard that shows status from every single service you manage, it would be difficult for your clients to navigate and get anything useful out of it when it comes to answering the question "Is so-and-so down?" The problem is compounded by services that have internal health dashboards like Microsoft 365, as their status is tied to specific tenants.
The not-so-great options here are to keep a spreadsheet somewhere mapping each service to its status page, and which clients use what. It's not hard to imagine how unmanageable it will be.
A shared, single status page also has the same failed outcome - it's noise. Nobody wants to see service statuses they don't use. Per-client isolation is a basic requirement for a status page. The section that follows will walk you through examples of two possible solutions.
Two Ways To Give Each Client a Scoped View
There are two ways to deliver a per-client view, and the right one depends on your team and their expertise more than your size. IncidentHub provides both, working from the same set of official vendor status feeds - around 1070 vendors as of this writing - so that the underlying data is identical (and official) whichever option you choose. The difference between the approaches is in who builds the front end.
Option One: The Hosted, Filtered Status Page
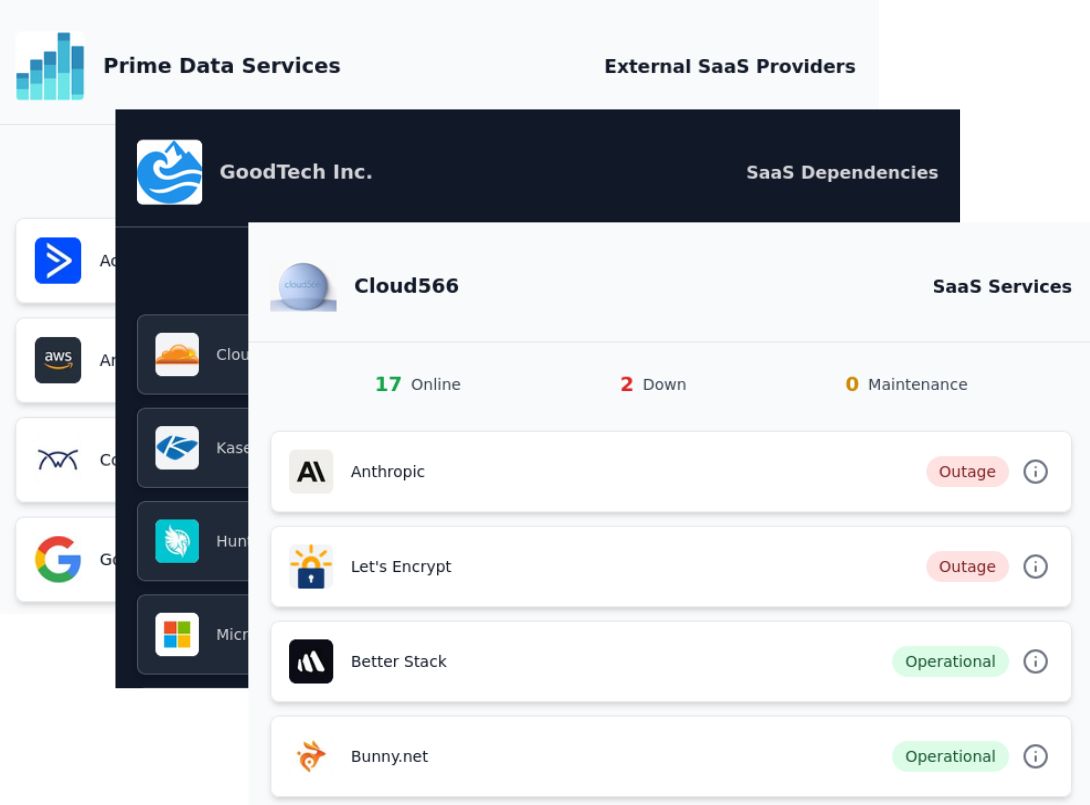
The first option is a status page you don't build yourself. You pick the services a given client depends on, and you get a page that shows only those - white-label, on your own domain, isolated so that client sees nothing belonging to anyone else. You send them the link, or embed it where they already look. When Xero opens an incident, it shows up on that client's page.
What the client sees is a clean page with your branding and your domain in the address bar. There's no mention of any monitoring vendor, including the one providing the data. To the client it reads as something you built and run. The status reporting of the vendors' services you manage is part of your service.
Alternatively, you can also host each client's status page on a subdomain of the client's domain - e.g. vendor-status.clientdomain.com and use their branding.
This is the path for the majority of MSPs because it costs no engineering time. There's nothing to host, no status pages to parse, and no custom application to maintain. Monitoring your service stack starts and ends with these steps:
- Choose the vendors you want to monitor along with their regions/components.
- For private status (like Microsoft 365 and Microsoft Azure), connect to the tenant's health using official Microsoft APIs in a few clicks.
- White-label your status page.
If your reason for not doing per-client status pages so far has been that it's one more thing to build and run, this removes that reason. The tradeoff is that you take the page roughly as it comes: you control which services appear and the branding, not the layout or the workflow around it.
Option Two: The Custom Dashboard You Build on the Data Feed
The second option is for MSPs who already run a client portal, an internal NOC view, or an app they'd want to surface this inside. Instead of a hosted page, you take the same vendor-status data as a live feed and render it yourself.
Technically it works off a webhook. IncidentHub pushes a structured JSON payload to your secure webhook endpoint every time a monitored service changes state - an incident opened, updated, or resolved. The webhook docs cover the payload shape and how to register your endpoint.
From that point onwards in the flow, it's in your control. A worked example:
- Your webhook endpoint receives the request payload
- Updates a per-client status panel in your portal or posts a message to the right Microsoft Teams channel
- Optionally, opens a ticket in your ticketing system
The data driving all of this is the same official vendor status (including internal health status for services like Microsoft 365 and Microsoft Azure after connecting to their tenant's health using official Microsoft APIs) that powers the hosted page; the presentation, the placement and the workflow are entirely under your control.
One MSP we work with does exactly this. They ingest the feed into their own client-facing app, so their customers see vendor status inside the same portal they already use for everything else, with no third-party branding anywhere in sight. The upside of building it yourself is that you can customize the presentation and workflow to your needs. There is a cost - this path assumes you have a developer and want to maintain a small integration. If you don't, the hosted page gets you to the same place for the client without writing a single line of code.
Which One Fits You?
The deciding factor here is primarily whether you have development capacity and something to build into. If you already run a client portal or an internal dashboard and have someone who can wire up a webhook, building it yourself puts vendor status where your clients and techs already are. If you don't, the hosted filtered page gets a client a correct, branded, scoped view today, with a mostly self-service setup.
Plenty of MSPs will do both, and that is reasonable too - hosted pages for most clients, and a custom build for the one or two larger accounts that already have a portal worth surfacing it in. The data's the same underneath, so mixing the two costs you nothing in consistency.
In either case, you have replaced two bad defaults. You're no longer tabbing through vendor pages per client during an incident, or logging into admin health dashboards, and you're no longer sending clients to a consumer site to find out whether their cloud provider is down. The client gets all the information they need, scoped to their stack, in one place.
Decision Table
| Your Situation | Recommended Approach |
|---|---|
| You want a per-client, white-labeled status view with no development effort | Hosted filtered status page - per-client isolation built in |
| You run your own portal or NOC and want your vendors' status in it | Webhook into your dashboard - account-wide stream filtered by region or component |
Where Else Can the Signal Go?
Once vendor status is available as a clean, normalized feed, the hosted page and the custom dashboard are two possible destinations for it. A few others are worth knowing about, with one caveat.
A filtered view can be embedded into a staff or client portal, or into a ticketing tool, so status sits next to your workflow rather than in a separate tab. The feed can be pushed into a client-portal platform like CloudRadial - as a data source, putting vendor status in front of clients where they already log in. It can be fed into your operational tooling for correlation as well - a vendor incident lined up side by side your own alerts in Datadog, PagerDuty or Grafana shortens the time it takes to conclude "this is them, not us" when the provenance of an incident is still unclear.
What IncidentHub does today is the webhook and the hosted, filtered status page. The rest - feeding the data into a client-portal platform or an observability tool - is a direction the webhook supports, something you'd wire up yourself. It's not a button that ships today. It's also worth pointing out that the same monitoring is also applicable for the tools you run yourself - your PSA and RMM, ConnectWise or NinjaOne - so you can also find out at a glance when your own stack is down, not just a client's vendor.
What This Doesn't Solve
There are a couple of limits here. First, the official vendor status is only as good as the vendor: some post quickly and accurately, whereas others lag a real outage by minutes or quietly update the page after it's over. Sometimes the lag is due to the vendor's own on-call or other internal processes. However, when the status is updated, it is official.
Second, this watches your clients' external dependencies, not their own infrastructure. It tells you when Xero, Microsoft 365 or a client's ISP is down - it doesn't tell you when the client's own server, network or line-of-business app has problems. That's a separate job their existing monitoring needs to cover. The vendor monitoring sits alongside it to handle the vendors, which most monitoring can't see.
Where To Start
If you've been meaning to give clients a real answer when a vendor breaks, start with the constraint that actually decides it: do you have a developer and somewhere to build into. If yes, take the feed and put vendor status inside the portal or dashboard your clients and techs already use. If no, switch on a hosted filtered page per client with a few clicks.
The point of either is the same. When a client asks whether a vendor is down, the answer comes from you, scoped to what they run, and quickly. They never have to see a vendor's status page to get it. If you want to see the per-client page and the feed in practice, the demo and the MSP pages walk through both.
Conclusion
Vendor outages are one of the few IT problems that genuinely aren't your fault. However, the minutes after one occurs are still yours, and how you handle them matters for your client relationship. The gap between tabbing through status pages while they wait and handing them a branded page that already shows what's wrong is small to set up and very visible to the client. Whichever route you pick, the shift in trust and the value you provide are the same. Vendor status stops being something you scramble to look up and becomes something the client can already see, scoped to their services, in one place.
Create your own per-client vendor status page.
Sign up for a free account at IncidentHub - choose the Multi-client plan and follow the steps.
IncidentHub is not affiliated with any of the services and vendors mentioned in this article. All the logos and company names are trademarks or registered trademarks of their respective holders
This article was first published on the IncidentHub blog.