H1 2026 Cloud and SaaS Reliability Report


Introduction
Last updated on October 7, 2026.
The first half of 2026 reinforced a key idea about Cloud and SaaS reliability - dependency risk. IncidentHub tracked 30,246 outages across 1,082 providers between January and June 2026. May was the busiest month, with 6,070 incidents. Cloud providers led in the total number of outages (4,723), followed closely by developer tools (4,589).
Besides volume, AI providers moved firmly into the production infrastructure layer with LLM outages resulting in disruption across EdTech, developer tooling, customer support, and communication tools. Automation created new failure modes of its own: Google Cloud's May suspension of Railway's account resulted in almost all their workloads being unavailable. Edge and CDN incidents kept multiplying downstream, IAM remained a login bottleneck for entire product stacks, and Canvas's May security incident took classrooms offline during exam season.
This report breaks down H1 2026 by layer - cloud, edge and DNS, IAM, developer tools, collaboration, AI, payments, observability, and EdTech - with the major incidents, category trends, and cascade patterns based on the data.
Download a summary of the report as a PDF
- Introduction
- Methodology
- H1 2026: Outage Numbers at a Glance
- Cloud Provider Outages
- Edge, CDN and DNS Outages
- Identity and Access Management (IAM) Outages
- Developer Tools Outages
- Communication and Collaboration Outages
- AI and LLM Tools Outages
- Payment Infrastructure Outages
- Observability, Monitoring and Incident Management Tools Outages
- EdTech Outages
- H1 2026 Outage Patterns
- Patterns in Distributed Infrastructure Outages
- Conclusion
- FAQ
Methodology
What We Monitor
- 1,125+ providers (as of this writing) monitored continuously: cloud infrastructure providers, SaaS platforms, developer tools, AI providers, payment processors, edtech platforms, observability tools, and communication services. A subset is used for this report.
- Monitoring is via public status pages (APIs, webhooks, RSS feeds). Private status monitoring (Microsoft Azure, Microsoft 365 etc) is also done but we did not use those numbers for this report.
How We Define an Outage
- An outage is created when a provider updates their status page to indicate degraded performance, a minor issue, or a major issue. The terminology differs across providers.
- An outage is closed when the provider marks it as resolved.
How We Measure Duration
- Duration is calculated from the provider's first incident acknowledgment timestamp to their resolution timestamp.
- Also, the provider-reported resolution may lag actual service restoration in some cases due to internal processes and checklists across their systems.
All timestamps are in UTC.
Scope of This Report
- This report covers the period from January 1, 2026 to June 30, 2026.
- All data is sourced from provider status pages (APIs, webhooks, RSS feeds) as monitored by IncidentHub.
- Maintenance updates are excluded from this report.
- All aggregate figures in this report - total incidents, total downtime hours, category counts, month-by-month trends - are computed over a fixed set: the set of providers with complete, continuous monitoring coverage from January 1 to June 30, 2026. This includes 1,082 providers, a subset of IncidentHub's 1,125+ monitored providers. This means that providers added to IncidentHub mid-period (providers are added to IncidentHub's monitored set periodically and on request) are outside the scope.
Limitations
- IncidentHub monitors public status pages which usually reflect outages affecting many customers. Smaller outages affecting fewer customers may not be tracked by status pages.
- Duration data reflects provider-reported timelines.
- Some large providers are not yet in the monitored set (e.g., certain APAC clouds and a number of payment, edtech, observability tools). We hope to cover these gaps in upcoming reports.
- There are providers that can potentially fall into multiple categories (e.g. AWS has cloud hosting, CDN, DNS, and so on). In such cases we included them in the category that is the most relevant. So AWS comes under Cloud Providers, not CDN/DNS and Edge Infrastructure.
- Outage counts should not be taken as a reliability ranking across providers. Providers vary in what they publish on their status pages, and a lot also depends on the provider's product offerings. E.g., Cloudflare has hundreds of edge locations around the world, and a localized outage in one POP still counts as one outage.
This report does not rank providers.
H1 2026: Outage Numbers at a Glance
H1 2026 Outage Statistics
- Total outages tracked across all providers: 30,246
- % of monitored providers that experienced zero outages in H1 2026: 15.9%
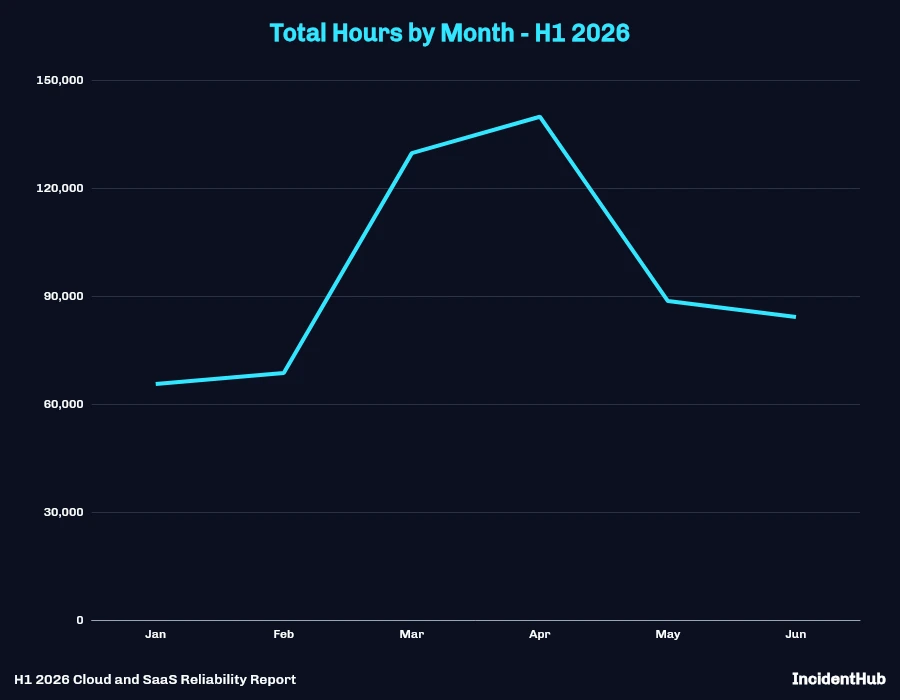
- Worst single month by outage count: May 2026 with 6,070 outages
- Most outage-prone category: Cloud Providers with 4,723 outages across 86 distinct providers
- Highest average outages per provider per month: 9.44 in May 2026 (across 643 providers that had at least one outage that month)
- Top 2 categories which had upstream issues (i.e. another provider) as the root cause: Cloud Providers and Developer Tools
H1 2026 Outages by Category
Cloud providers topped the list with 4,723 outages across 86 providers, with Developer Tools coming in a close second with 4,589.
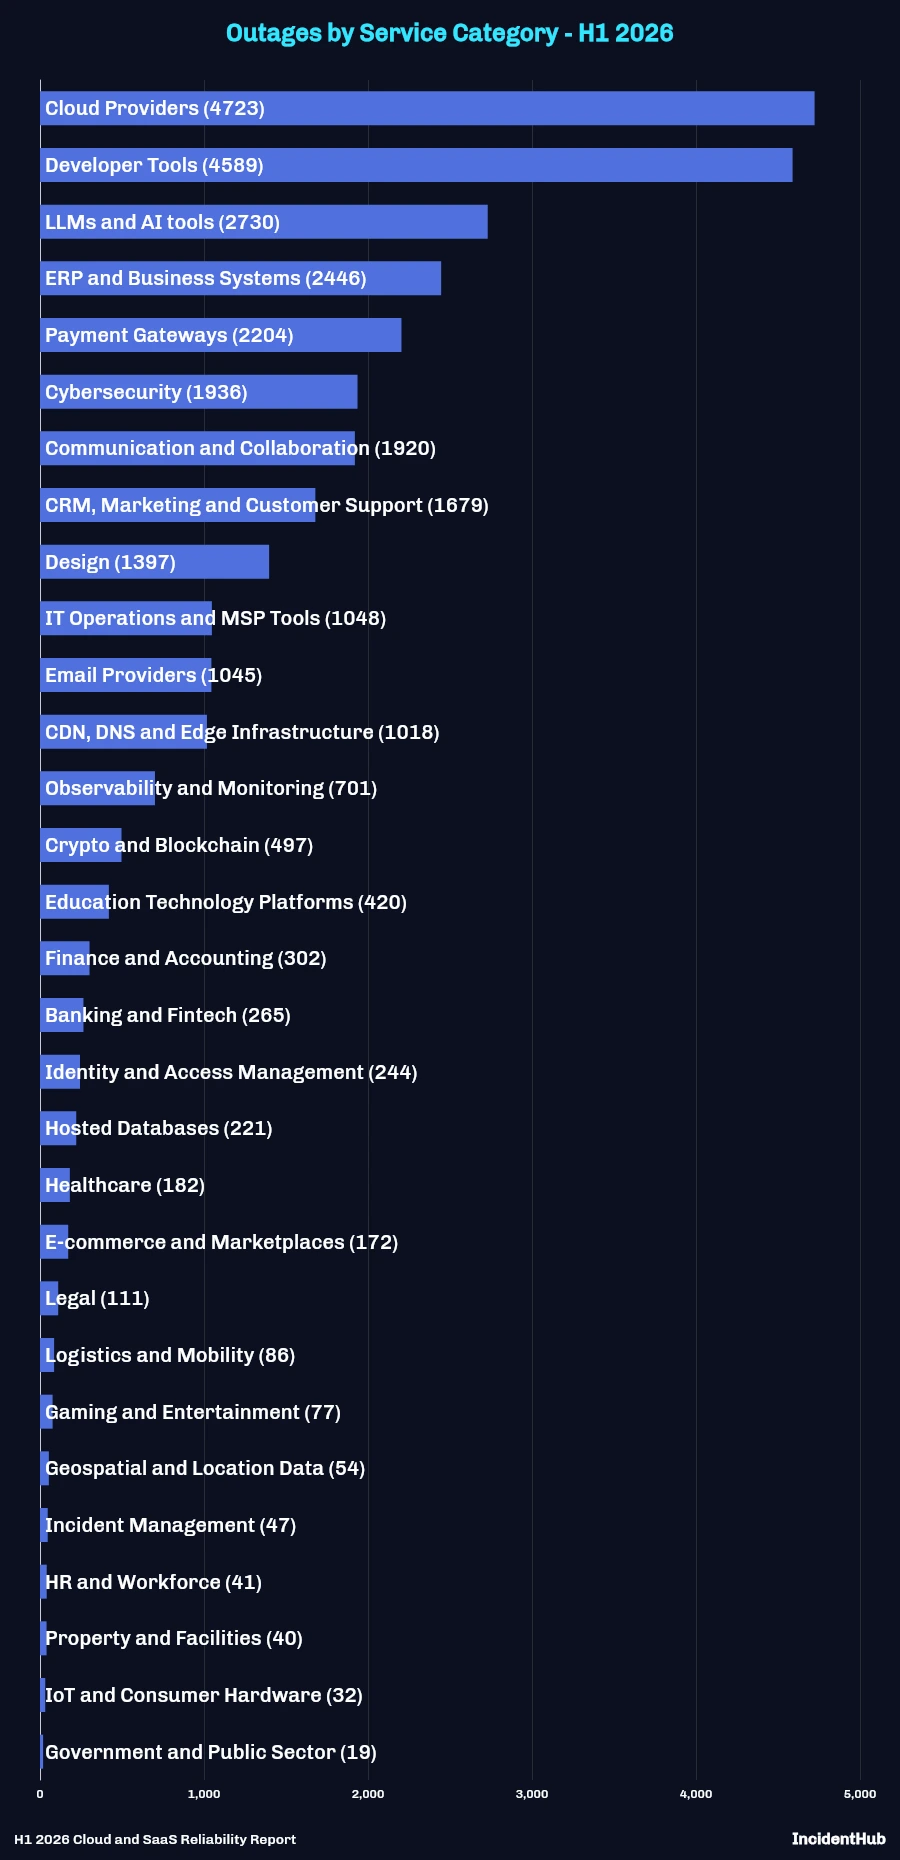
This report covers some key categories in detail.
Cloud Provider Outages
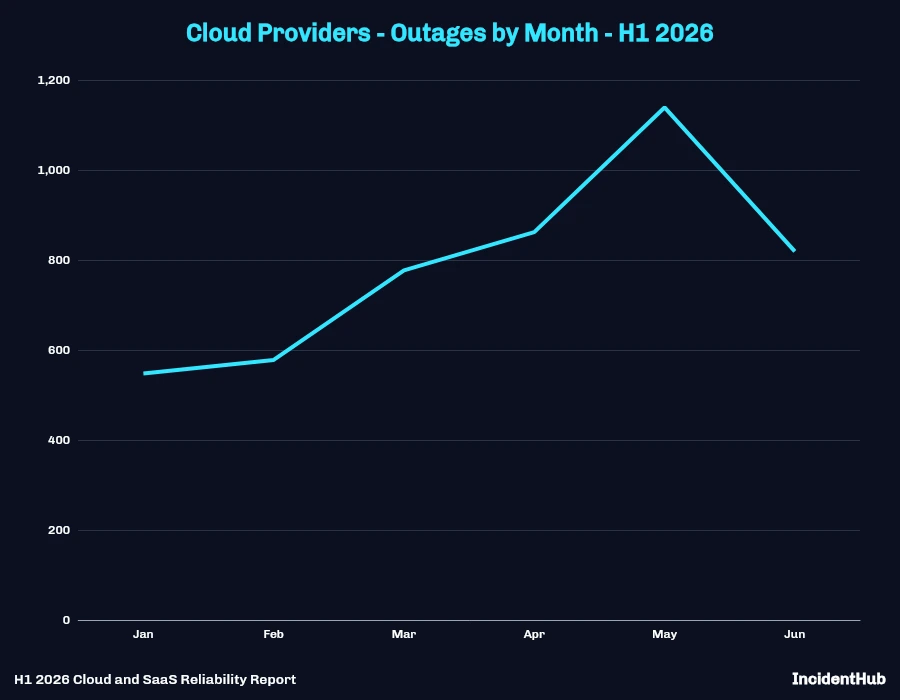
Cloud Providers saw the highest number of outages in H1 2026 - 4,723 across 86 separate providers. These include both major and minor incidents. May 2026 saw the highest number of cloud provider outages at 1,139 (in 67 different providers). The upward trend from January to May slowed down in June.
In early March, AWS reported that their Middle-Eastern datacenters (me-central-1 and me-south-1) "experienced physical impacts to infrastructure as a result of drone strikes" in the armed conflict in the Middle East. The downstream impact was significant, with services like Salesforce and Slack which have data residency requirements experiencing disruption. Salesforce undertook a migration of user data to their Sweden region, which took around 3 weeks and 5 days to complete. Confluent advised customers with workloads in these regions to migrate to other regions.
Since then, AWS has stated that me-central-1 is currently unable to reliably support customer applications, though some workloads continue to function normally, and recommends customers migrate accessible resources and restore the rest from remote backups. The me-south-1 region is described as currently unavailable, with customers advised to recover resources in other regions. Billing operations are suspended in both, and AWS expects restoring normal operations to "take several months."
Other incidents lasting for a significant duration were:
- Google Cloud's network traffic originating from Delhi, Chennai, Mumbai and surrounding areas experienced degradation due to a datacenter fire. It took 21 days 12 hours to fully mitigate.
- OVHcloud's Web Hosting Incident. 5 days 18 hours to fully mitigate.
- Hetzner's Object Storage degradation in nbg1. 27 days 16 hours to fully mitigate.
- Hetzner's Object Storage degradation in hel1. 31 days 13 hours to fully mitigate.
DoIT's incident which caused inflated billing data for their Cloud Intelligence product took around 9 days to fully fix.
Another prolonged outage was in Scaleway's object storage service - which took around 51 days as they had to roll out a fix to every region. There was no impact on user data, as noted in the incident update.
In terms of impact and not just duration, Railway's outage on May 19, 2026 was caused by GCP's automated account suspension and led to widespread downtime for Railway's customers. Also in May, Canvas (Instructure) had a security incident which affected their service, disrupting educational institutions across the world.
Why does resolution take so long for some outages? Does a longer duration imply more impact?
Outages which are dependent on external factors, such as network infrastructure connecting datacenters across geographies, can take a long time before they are declared resolved. An example is 2025's Red Sea cable cuts which affected Microsoft Azure's traffic flow. They rerouted traffic through alternate paths - communication continued but at a slower pace.
A longer duration does not necessarily imply more impact. For example, a fix to a cloud provider's infrastructure which is scattered across the globe can take time to be rolled out. Priority will be given to the regions where customers are actually affected by the outage, which means that the impact is not always proportional to the duration.
Amazon Web Services (AWS)
- Total H1 2026 incidents across all tracked regions: 14, including the 2 Middle-East region outages.
- Keeping aside the two Middle-East regions as a special case, the most downtime was seen in us-east-1, followed by eu-west-1.
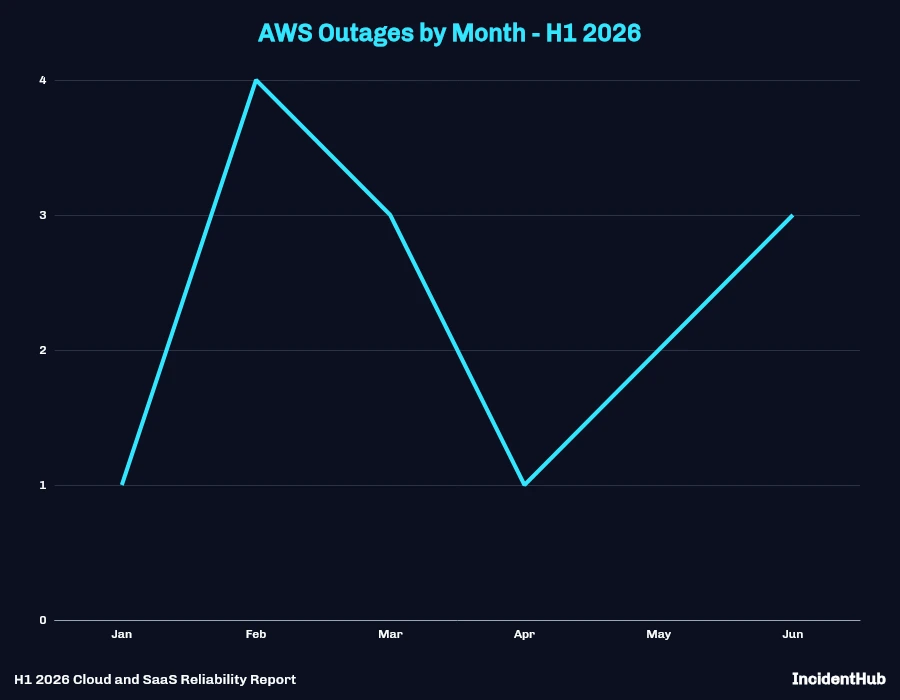
February saw 4 AWS outages, but the average has stayed around 2 per month.
AWS services affected most frequently were Amazon Elastic Load Balancing, Amazon EKS, AWS NAT Gateway, and OpenSearch.
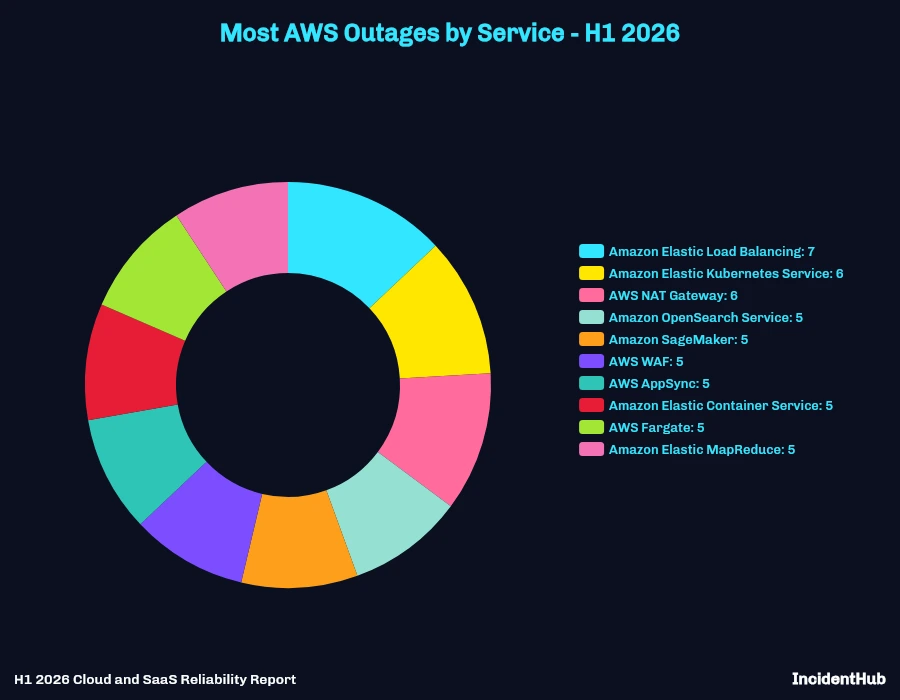
The longest outages (again, excluding the Middle-East region outages) were:
- Fable 5 and Mythos 5 Access - affecting AWS Bedrock (June 13-15, 2026). AWS closed the outage on June 15 while the suspension continued till July 1.
- Increased Error Rate and Latency in EC2 affecting us-east-1 services (May 8, 2026).
- CloudFront change propagation issues (February 10-11, 2026) affecting global services like Route 53.
Microsoft Azure
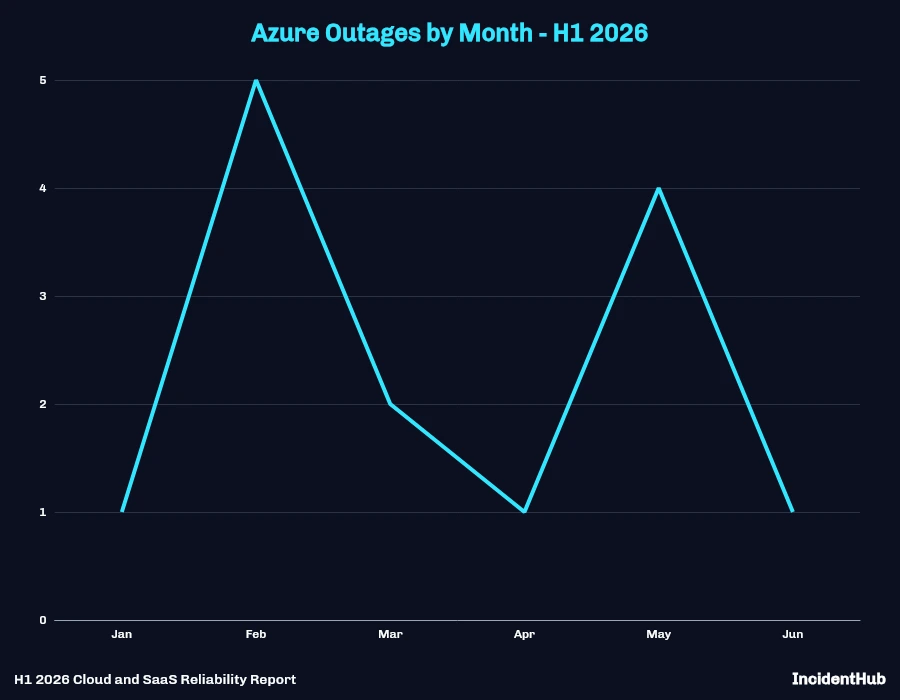
- Total H1 2026 incidents across all tracked regions (public status page data only): 14
- Most outages in February 2026 with 5 incidents
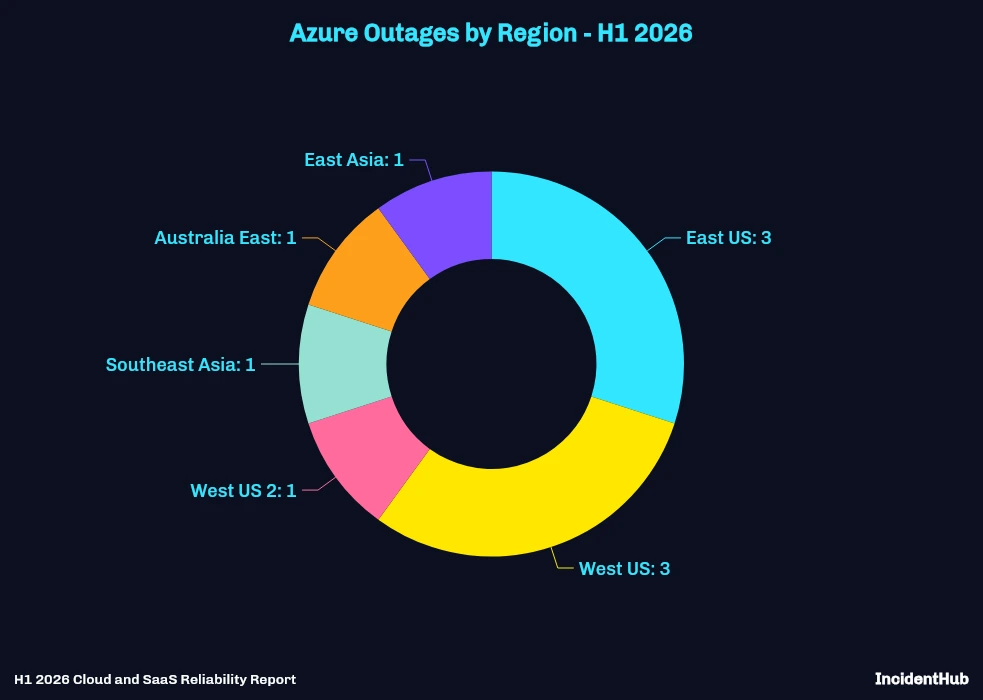
Both East US and West US saw 3 outages each.
Most impactful Azure outages in H1 2026 were:
- Control plane issues in East US on April 24, lasting 12+ hours. The impact was felt across multiple Azure services in multiple AZs in the region. The outage started as lock contention errors in the PubSub control plane in a single AZ. The errors in turn triggered a failover which remained incomplete. A manual failover attempt was also unsuccessful, and was followed by issues in other AZs.
- Outage affecting Azure Virtual Machines, Azure Kubernetes Service, and Azure DevOps between 18:03 UTC on February 2, 2026 and approximately 00:30 UTC on February 3, 2026.
Google Cloud Platform (GCP)
- Total H1 2026 incidents across all tracked regions: 2
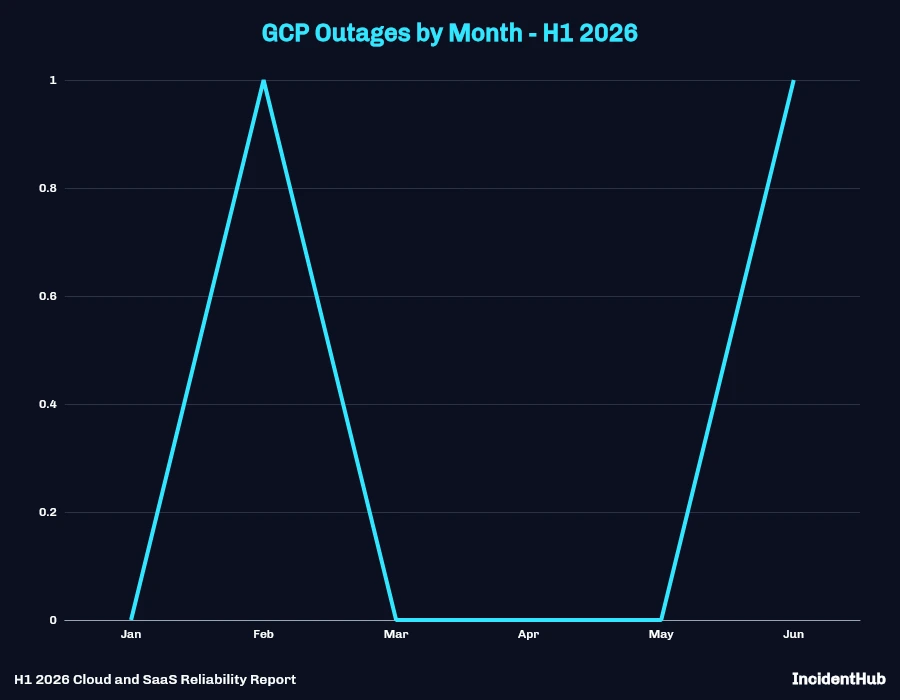
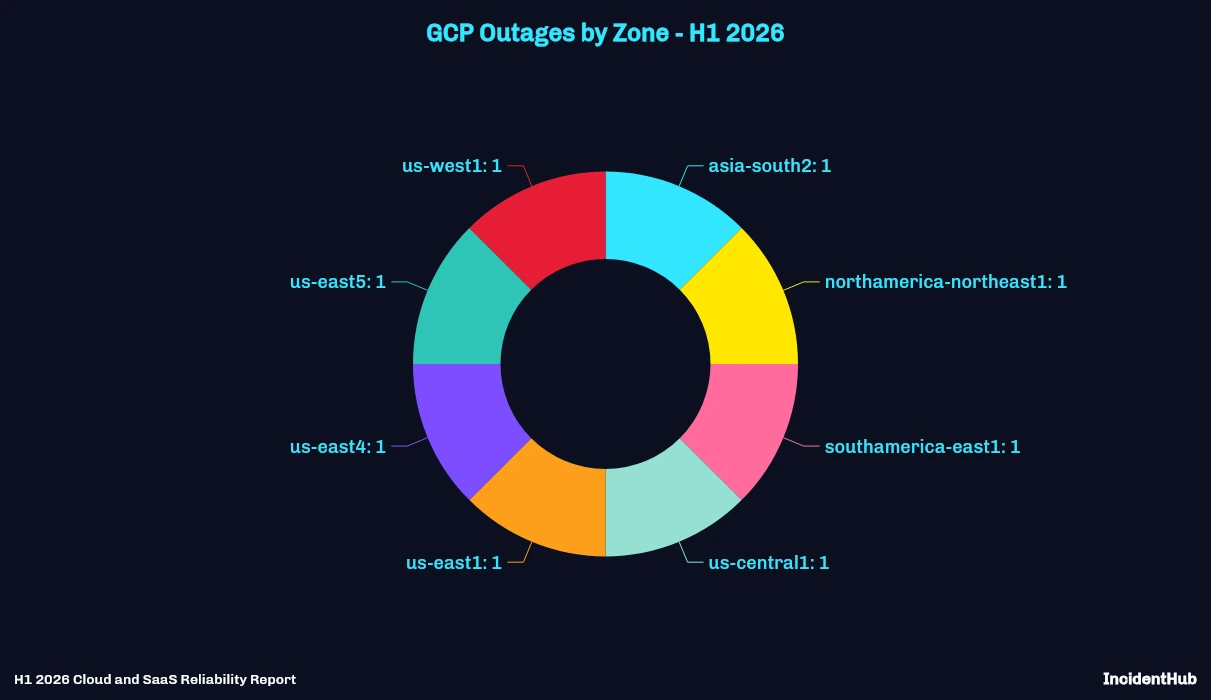
Note that this does not include outages in other Google services like Google Maps Platform, Google Play, or Google Ads. Note also outage counts are not comparable across the providers in this section. Each provider decides what goes on its status page and at what granularity. A lower count does not mean a provider is more reliable - it may be publishing only widespread incidents, or grouping into one entry what another provider would post as several.
Oracle Cloud Infrastructure (OCI)
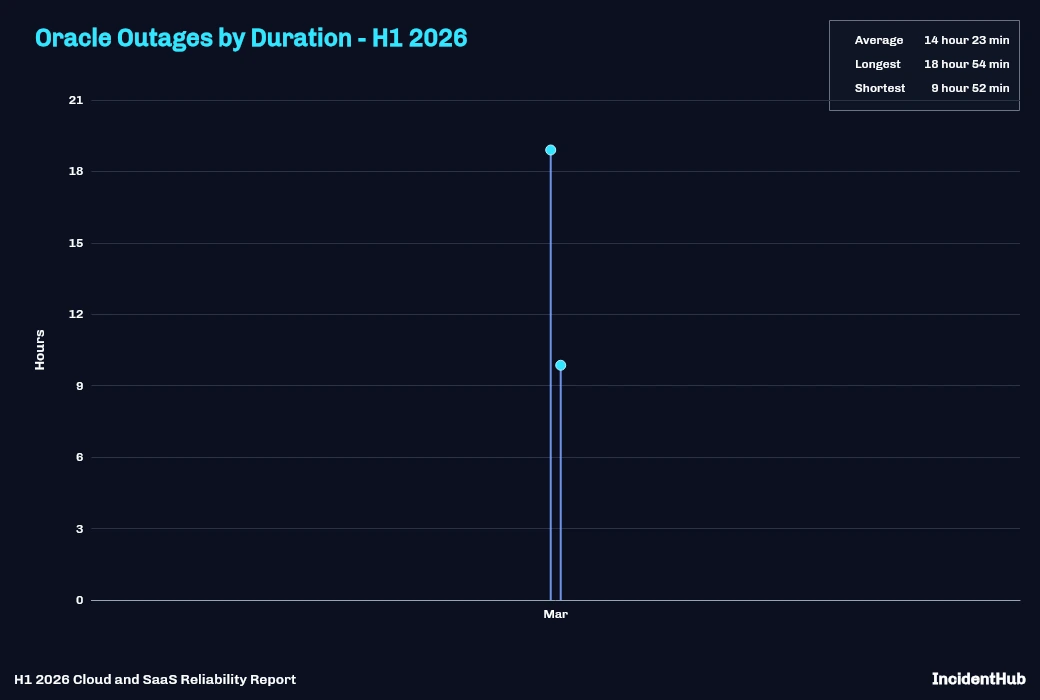
- Total H1 2026 incidents: 2
Oracle Cloud had one major networking-related outage in US East on March 3-4, 2026. The root cause was identified at around 00:44 UTC on March 4, 2026, after around 10 hours since the outage started. Fixes were applied and the outage was declared resolved after 8 more hours.
The Railway Outage May 19, 2026
Summary
At 22:20 UTC on May 19, 2026, Google Cloud automatically placed Railway's production account into a suspended state. This disabled Railway's cloud infrastructure, including their API, control plane, and databases. Railway's edge proxies maintained service briefly via cached routing tables - but as those caches expired, the outage extended to all Railway workloads, including those running on Railway Metal and AWS. Workloads that were running and healthy became unreachable because the control plane that routed traffic to them was offline.
Duration
Approximately 8 hours (22:20 UTC May 19 to ~06:14 UTC May 20)
Why it Matters
This outage illustrates a distinct risk category: automated enforcement actions by a cloud provider that take effect without prior notice. Railway noted that they were able to engage directly with their GCP account manager, and their account was restored soon. However, recovery took a while because individual artifacts took time to come back online. Pressure from queued deployments also added to the timeline.
Railway's postmortem was transparent: "We take full responsibility for the architectural decisions that allowed a single upstream provider action to cascade into a platform-wide outage." They also outlined preventive measures they are taking to avoid such incidents in the future.
This is not an isolated incident. Google Cloud erased Australian pension fund UniSuper's GCVE Private Cloud infrastructure in 2024 under different circumstances.
Sources
- Railway Postmortem: https://blog.railway.com/p/incident-report-may-19-2026-gcp-account-outage
Edge, CDN and DNS Outages
Edge, CDN, and DNS providers sit upstream of most of the services covered in this report. They form the core infrastructure components of the internet. As we have seen in both 2025 and 2026, they can have a ripple effect across thousands of downstream websites, SaaS applications, and other services.
When one of them fails, the outage multiplies across every site and SaaS product that depends on that provider for traffic, caching, or name resolution. A well-engineered application can still go dark if its CDN returns errors or its DNS stops resolving. We saw this in Cloudflare's November and December 2025 outages, and the same pattern shows up in H1 2026.
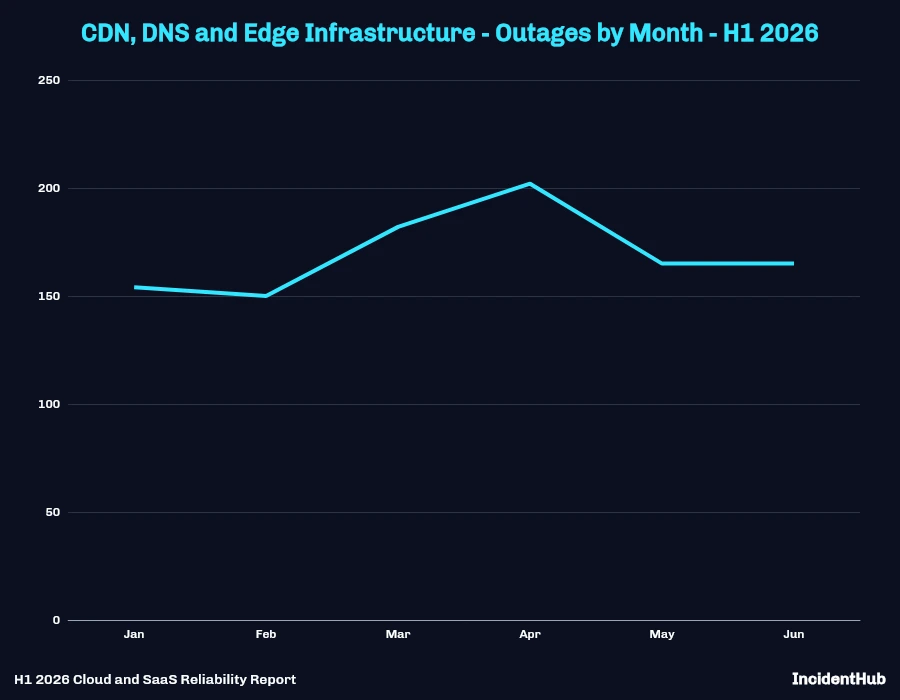
16 providers in this category had a total of 1,018 outages in H1 2026, with April seeing an uptick.
Cloudflare
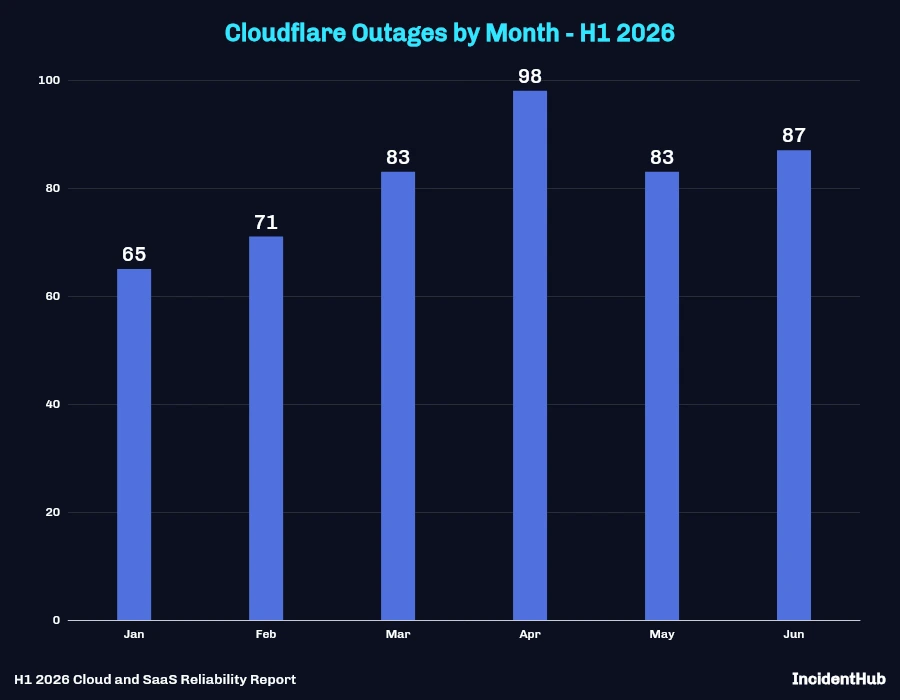
Cloudflare had 487 major and minor outages in H1 2026. April saw the highest number of outages at 98. The graph for Cloudflare roughly mimics the overall Edge, CDN, and DNS graph above because of Cloudflare's widespread presence.
In 2025, Cloudflare saw two major outages - one in November and one in December. The November 18 outage affected thousands of sites and services, multiplying the impact downstream.
Some of the major Cloudflare incidents in H1 2026:
- An increase in HTTP request latency in Newark, NJ started on February 16, 2026 at 10:19 UTC, when Cloudflare began investigating higher than usual latency for a subset of HTTP requests. A fix was implemented on February 26, 2026 at 10:12 UTC - roughly 10 days after the incident began. Cloudflare then monitored the results for several days before declaring the incident resolved on March 2, 2026 at 09:15 UTC - about 4 days after the fix went in.
- On May 5, 2026 at 08:04 UTC, Cloudflare opened an investigation into Bot Management Issues - unexpected increases in rule matches for a couple of detection IDs. The fix landed on May 6 at 09:39 UTC, about 1 day later. Cloudflare disabled the affected feature globally while detections stabilized over the following days, and marked the incident resolved on May 18 at 21:59 UTC - roughly 12 days after the fix.
- Cloudflare Access processing delayed audit logs was first reported on April 29, 2026 at 19:19 UTC. Cloudflare had a fix in place by 19:56 UTC the same day - under 40 minutes after the investigation started. Access itself stayed fully operational; the remaining work was clearing a backlog of audit logs from April 28-29. The incident closed on May 8 at 19:53 UTC, about 9 days after the fix, once ingestion of the delayed logs was complete.
Fastly
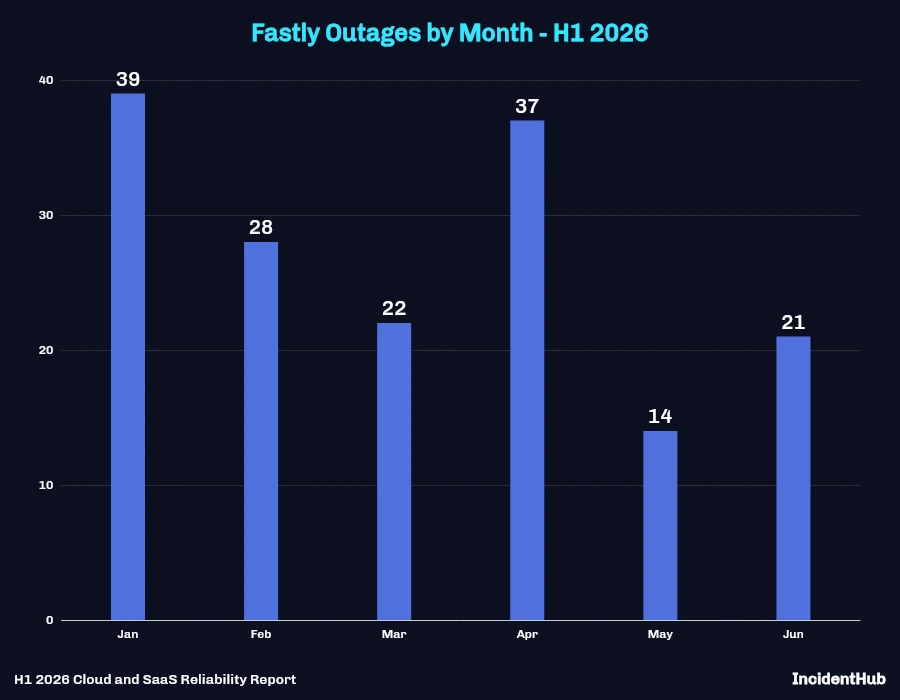
Fastly had 161 outages in H1 2026, with outages peaking in January and April.
- Elevated 425 responses in Google Chrome 145 release was posted on February 13, 2026 at 15:23 UTC after Fastly received reports of increased 425 Too Early responses for users on Google Chrome v145. The cause was a change in Chrome's retry logic for requests with query parameters, and not a Fastly platform defect. Fastly temporarily disabled 0-RTT on shared configurations on February 25 at 19:30 UTC as a mitigation - about 12 days after the incident opened. The Chrome team merged a fix in version 145.0.7632.115 on March 3, and Fastly marked the incident resolved on March 10 at 15:45 UTC after confirming full mitigation.
- Fastly engineers began investigating errors for Atlanta and Miami edge users on January 25, 2026 at 01:05 UTC. Elevated errors and intermittent latency hit customers routed through those two POPs; all other Fastly products and services were unaffected. A contributing factor was identified at 02:34 UTC, and impact was mitigated by 03:34 UTC - about 2 and a half hours after the investigation started. The incident was closed at 03:38 UTC once both POPs were fully restored.
Akamai
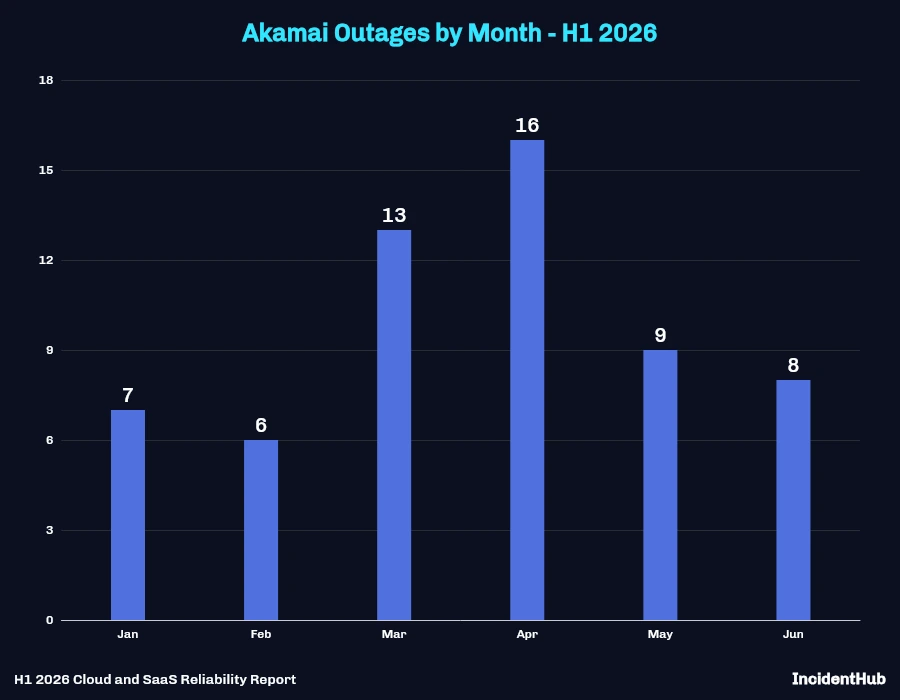
Akamai had 59 outages in H1 2026, with outages peaking in April.
- An issue in the Certificate Provisioning System (CPS) in the Akamai Control Center Portal was identified on February 11, 2026 at 21:09 UTC, when users had trouble accessing CPS through the Control Center. Akamai implemented a fix at 22:10 UTC the same day - about an hour after the issue was identified - and moved into monitoring shortly after. A short recurrence on February 17 (about 25 minutes of impact) led to extended monitoring and a longer-term software change. That change completed on March 19 at 17:00 UTC, and Akamai declared the incident resolved on March 20 at 19:17 UTC.
As with cloud providers, these counts are not comparable across providers. Cloudflare, Fastly, and Akamai differ in the size of their edge networks and in how granularly they post to their status pages. A localized issue at a single POP shows up as an outage on one provider's page and may not appear at all on another's.
DNS Outages
DNS being the address book layer of the internet, outages in DNS providers can have immediate and widespread impact.
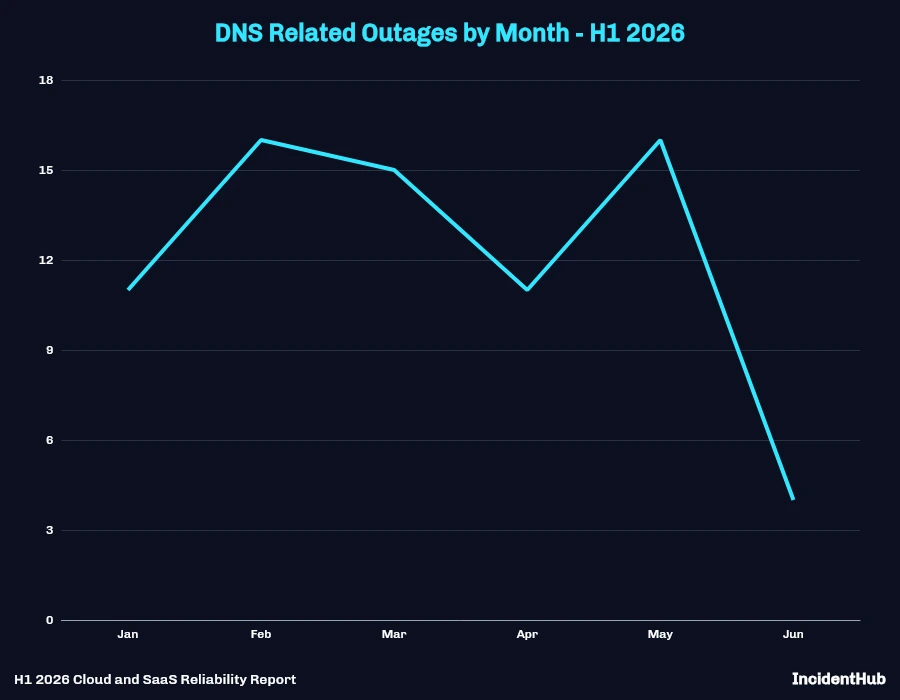
IncidentHub saw 73 DNS-related outages in H1 2026 across 30 different providers spanning categories, including pure DNS providers as well as cloud providers with DNS services.
Identity and Access Management (IAM) Outages
Moving up the stack, IAM is another foundational layer for applications - and where a failure can lead to users unable to use the service even if it is running.
The Authentication Dependency
- Every application requiring a login depends on its authentication provider.
- Auth providers can provide both authentication and authorization services.
- An auth provider outage affects every downstream application using it for SSO or identity.
These factors make the authentication layer one of the highest-leverage points of failure in the modern SaaS stack.
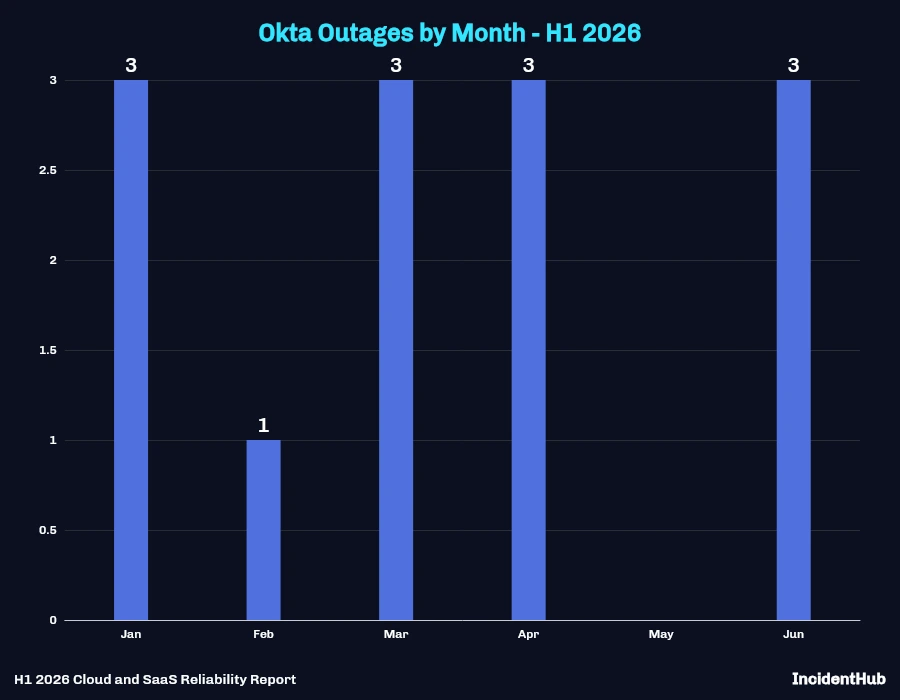
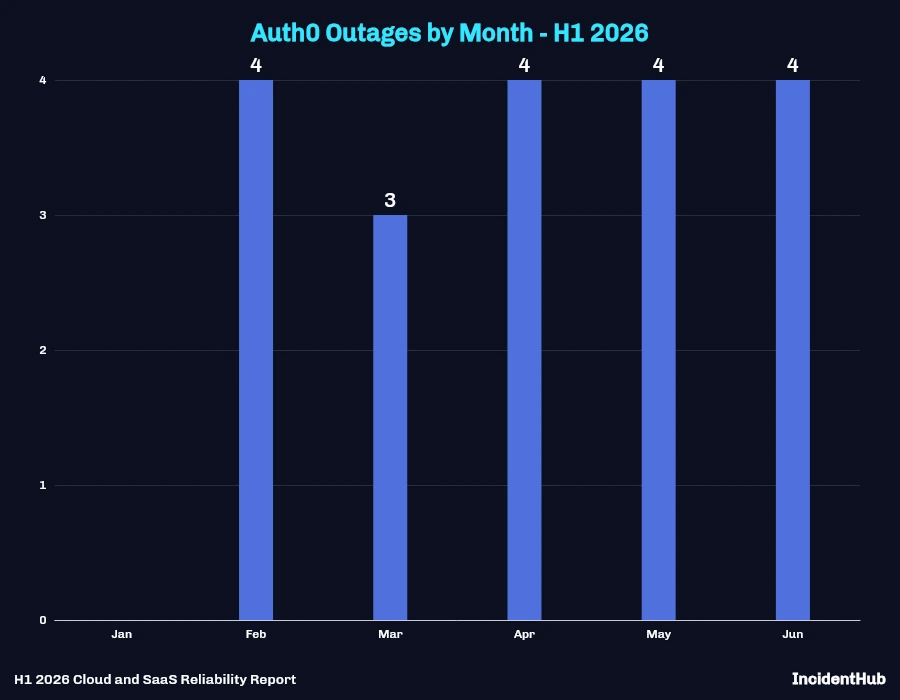
IAM provider outages rose steadily throughout H1 2026, peaking in May, and then showed a downward trend. IncidentHub detected 244 outages across 16 different providers.
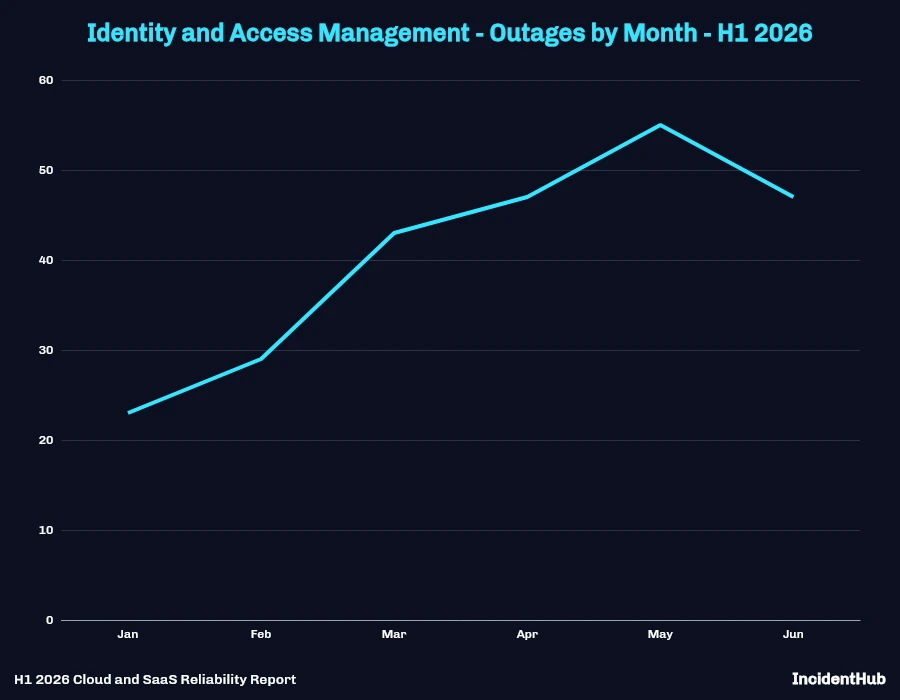
Okta recorded 13 and Auth0 19 outages in H1.
A dependency analysis of IAM outages across providers revealed downstream impact across many categories:
- Developer Tools: Draftbit was affected due to a Clerk outage.
- Cloud Providers: Cloudflare dashboard logins were affected by an Okta issue.
- IT Operations and MSP Tools: Nintex Workflow logins were affected by an identity provider outage.
- Developer Tools: Harness Traceable logins were affected by an Auth0 outage.
Other auth-related issues that caused outages:
- Communication and Collaboration: Box Drive SSO logins failed for about 3 hours on May 21-22, 2026 after an identity provider admin region was switched to passive by mistake.
- EdTech: Articulate 360 SSO provisioning was delayed for about 7 and a half hours on May 5-6, 2026 after a large internal data import overloaded user update processing.
Developer Tools Outages
Developer tools sat just behind cloud providers for total outages in H1 2026 - 4,589 across 187 providers. An outage in this category has varying impact depending on the tool:
- Source control software issues can obstruct production hot fixes by affecting build and deploy pipelines (think GitHub Actions).
- Artifact registries can impact downstream services (think Docker Hub outages affecting Railway deployments).
- Project management tools can slow coordination rather than block production.
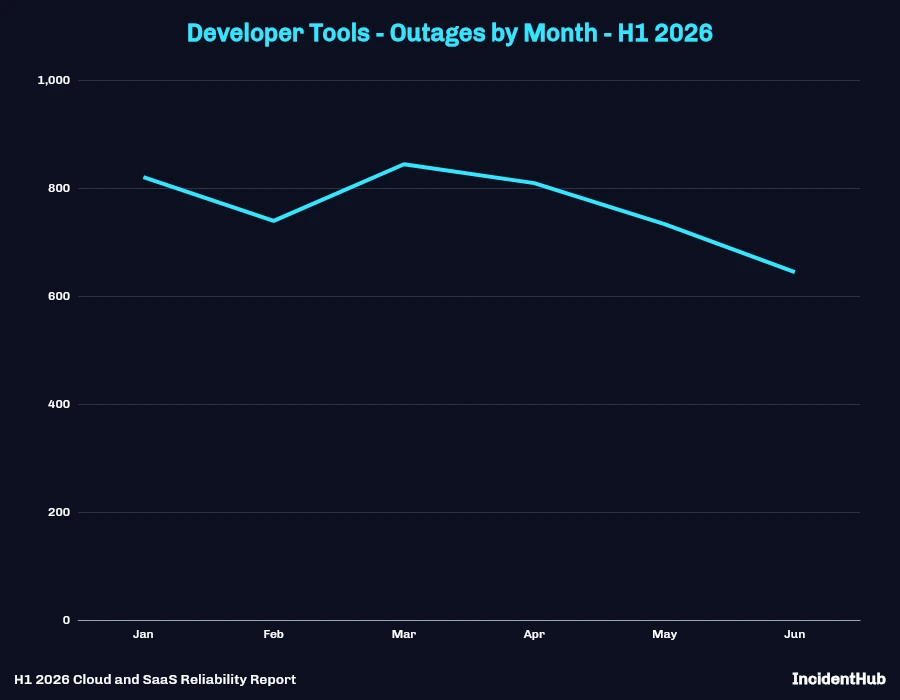
Developer tool outages peaked in March, with 844 incidents across 135 providers.
Source Control and Code Repositories
GitHub Outages
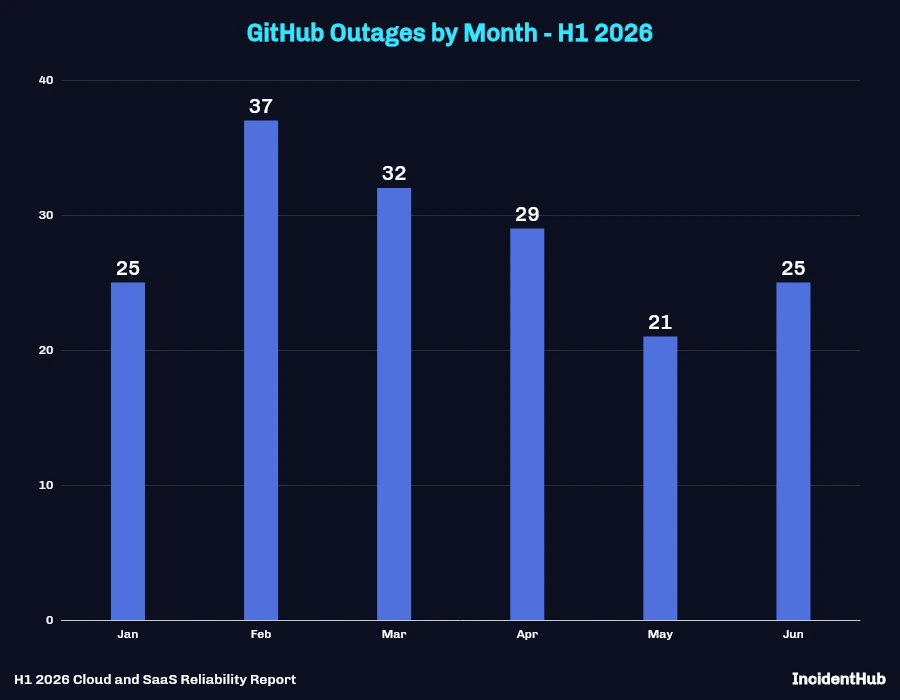
As noted in our previous report on GitHub's reliability between May 2025 and April 2026, February remained the worst month for GitHub outages. That statement remains true for this report as well.
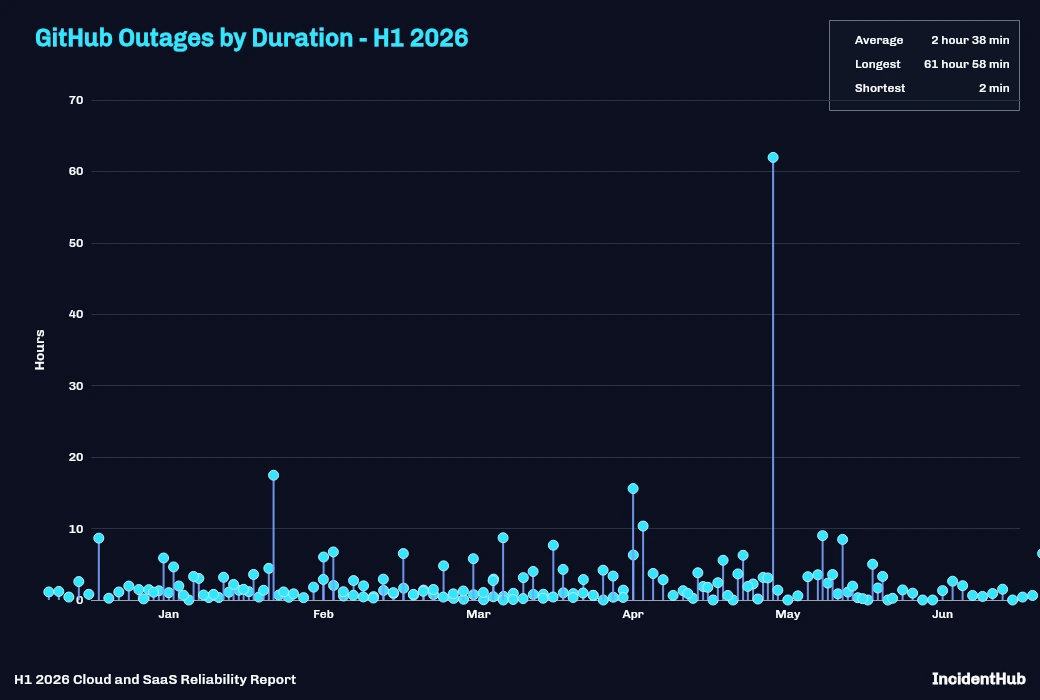
- Total H1 2026 incidents: 169
- GitHub Actions remained the worst affected with 37 recorded incidents, with Copilot and Pull Requests being next. These components directly affect the development workflow.
One of the longest outages went on for 2 days 13 hours between April 28 and May 1, resulting in pull requests not showing up in search results. A repair job for a single repository ran without safety flags and deleted about 1.8 billion PR documents from Elasticsearch - roughly half the indexed set - while opening, updating, and merging PRs stayed unaffected.
Other Source Control and Code Repositories
Compared to GitHub, other source control and code repositories had a much lower number of outages in H1 2026. However, it is important to note that these numbers do not take into account the number of projects hosted at GitLab or Bitbucket, and their traffic. GitHub has seen an explosion of traffic since 2024 which has stressed its infrastructure.
| Provider | Incidents |
|---|---|
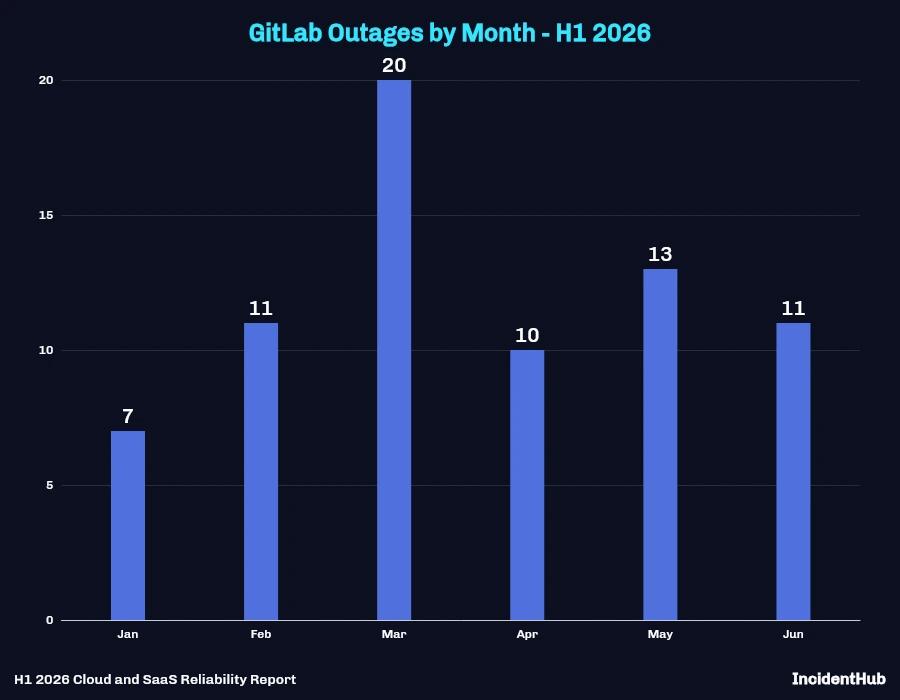
| GitLab | 72 |
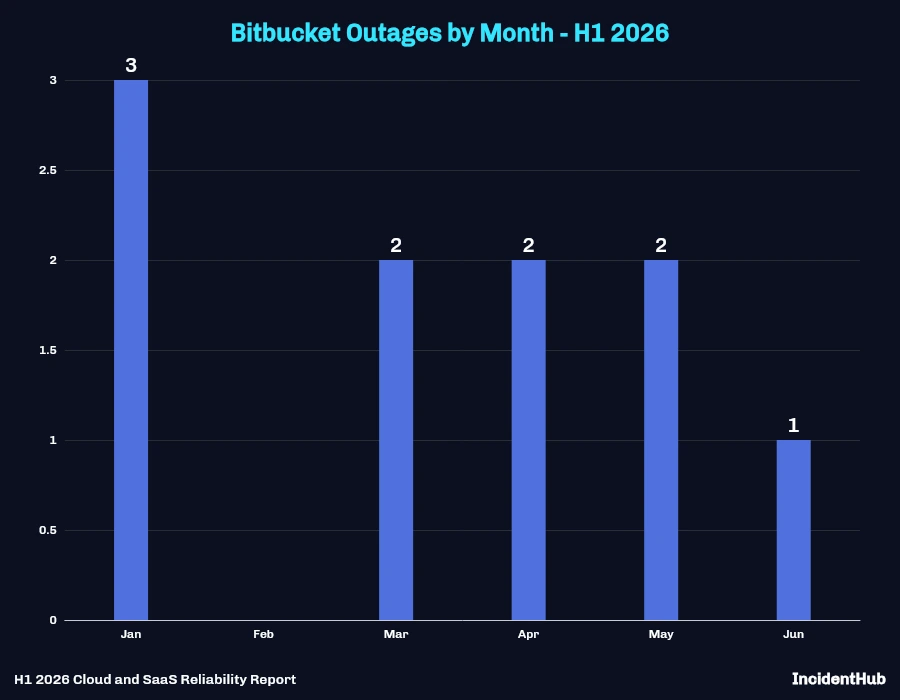
| Bitbucket | 10 |
| GitHub | 169 |
GitLab:
Bitbucket:
Package and Artifact Registries
Artifact registries are almost invisible layers in the modern stack. They can impact both deployment pipelines (e.g. hot fixes rolling out to production) and application runtimes (e.g. autoscaling failures due to image pull errors).
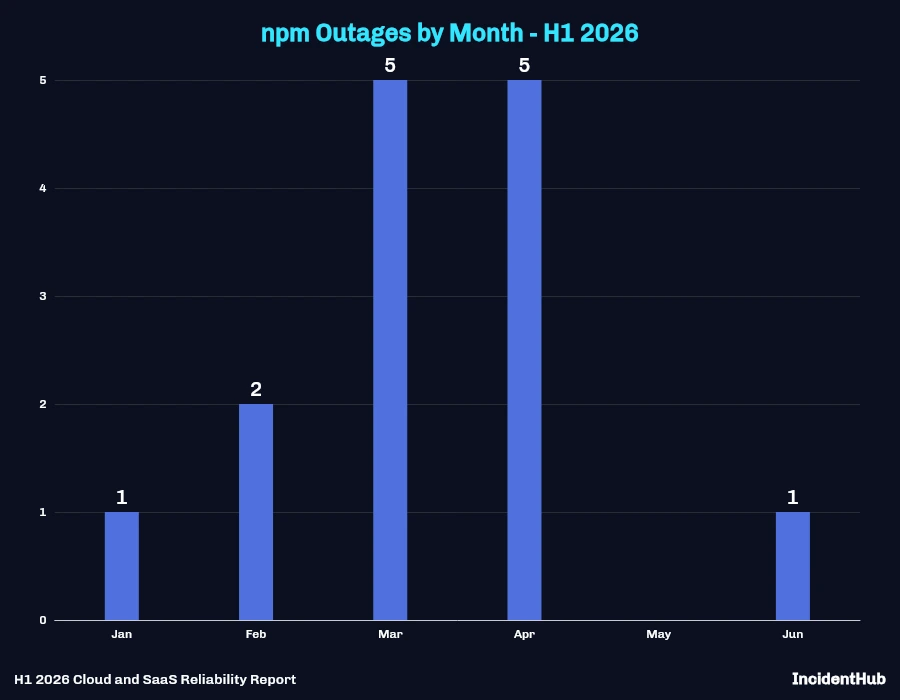
March and April saw npm outages increase, and it improved after that.
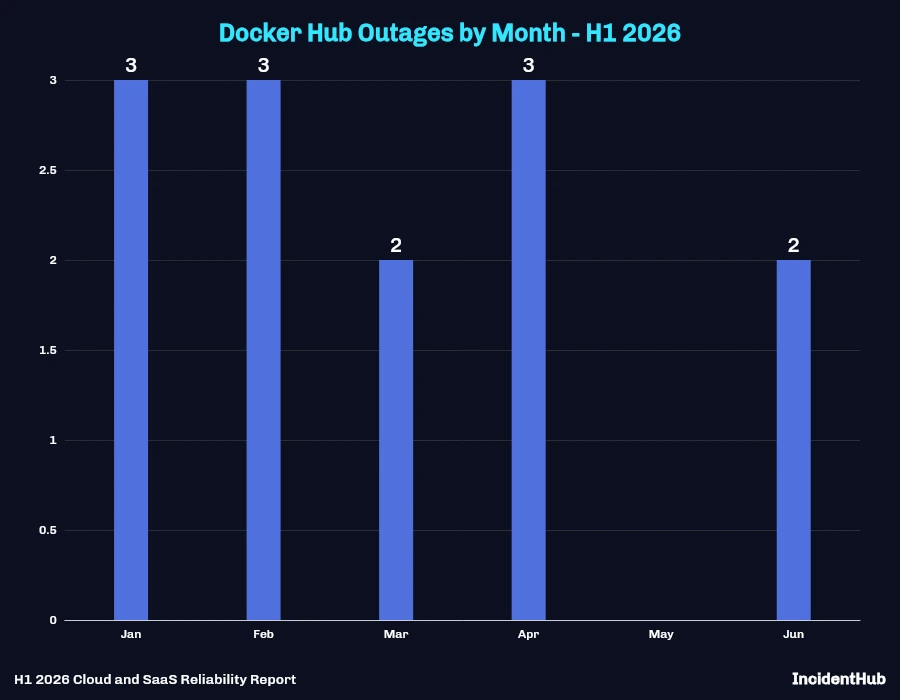
Docker Hub outages also showed a decrease by the time we reached June.
Communication and Collaboration Outages
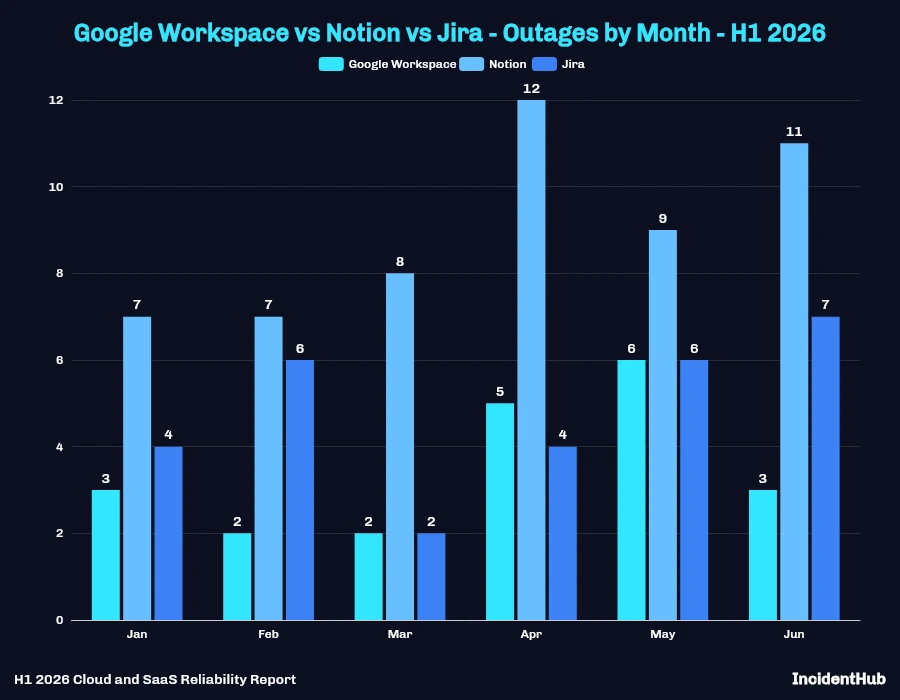
Messaging, video, and document platforms are part of the daily workflow of almost every person in an organization - not just engineering. When Slack, Teams, or Zoom fails, the outage is immediately visible across the organization. These tools are also how incident response itself is coordinated in some teams, so an outage during a broader infrastructure event compounds the damage.
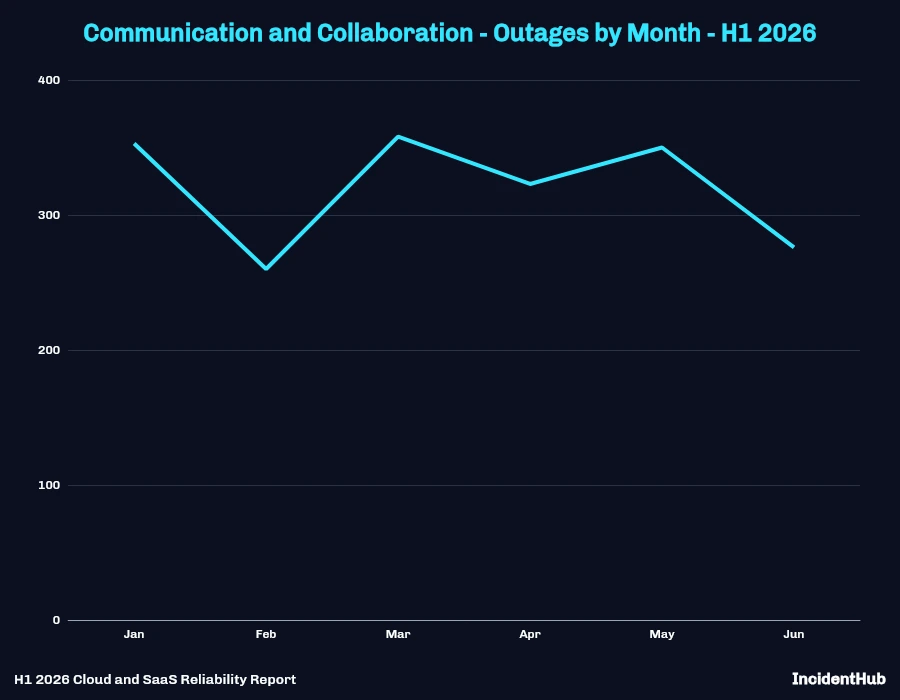
This category saw 1,920 outages across 75 distinct providers in the first half of 2026.
Messaging Platforms
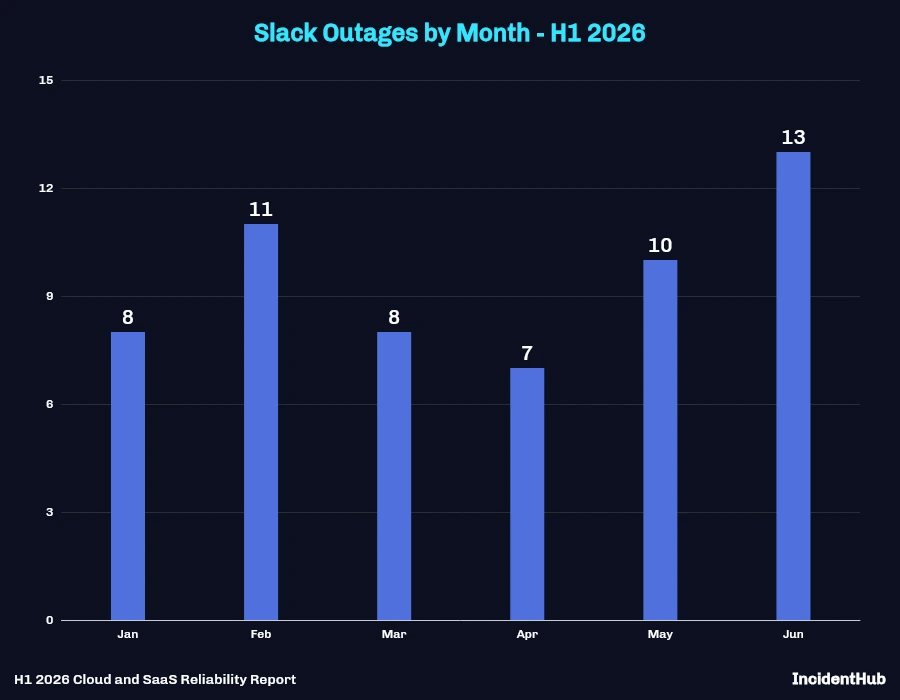
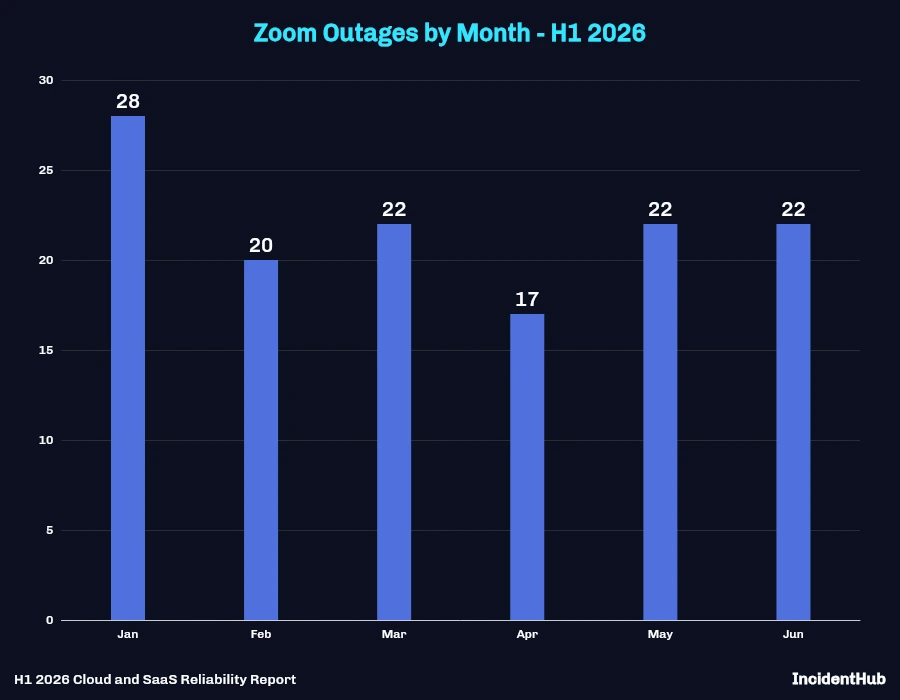
Slack experienced 57 incidents in H1 2026, whereas Zoom had 131 in the same period.
Zoom outages peaked in January.
Document and Knowledge Platforms
Project Management Tools
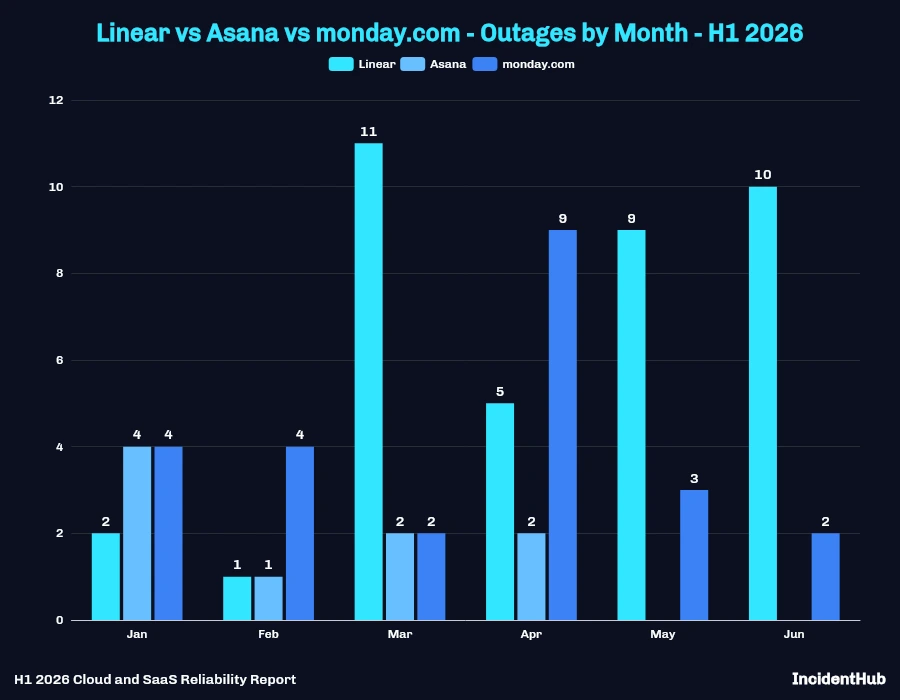
Linear, Asana, and Monday.com are compared here as work-tracking tools. Outages in this group slow down coordination rather than block deploys, which is why they rarely appear in incident retrospectives despite the volume.
AI and LLM Tools Outages
AI and LLM tools have a wider impact due to their widespread integration in the ecosystem, especially developer tools.
AI Providers as a Key Infrastructure Dependency
LLM APIs have become increasingly integrated into the core workflows of developer tools, customer support platforms, communication, and productivity tools. Any upstream outage either results in a partial or a complete loss of functionality. Developer tooling often uses multiple AI providers for different use cases as well as for fallback, but that is not always an option for other categories. This leaves the other categories with not much choice when the upstream LLM has a problem.
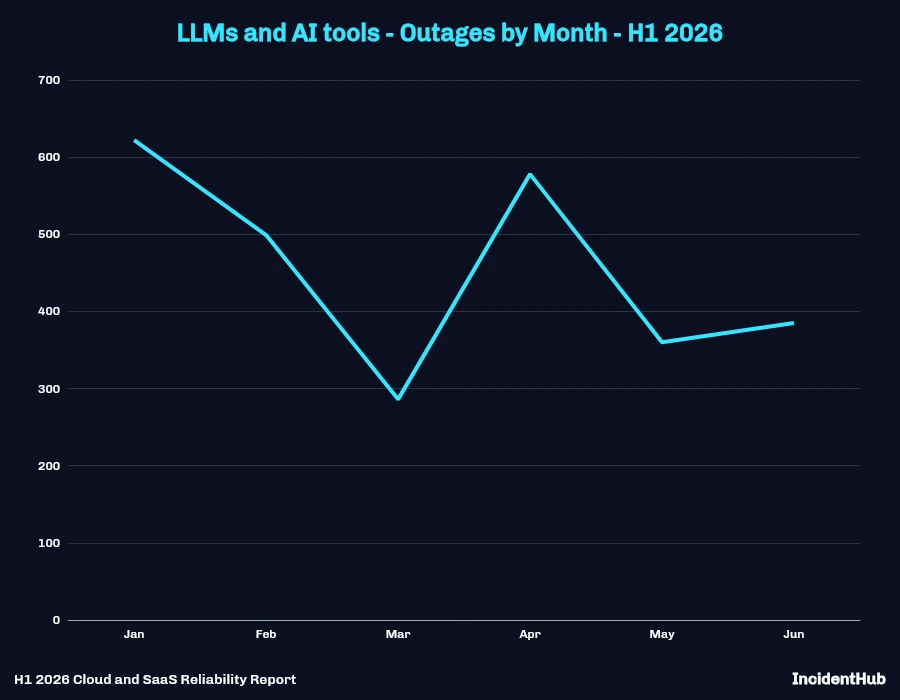
AI and LLM tools saw 2,730 outages across 34 distinct providers, with outages peaking in January.
Significant AI and LLM Incidents
- E2B: Intermittent volume request timeouts: volume requests began timing out on June 2 at 22:56 UTC and stayed degraded until June 23 at 06:13 UTC - 20 days 7 hours.
- Google AI Studio: AI Studio Build experiencing latency issues (no permalink available): Build latency ran from April 2 at 13:00 UTC to April 17 at 00:00 UTC - 14 days 11 hours.
- DataRobot: Problem connecting to DataRobot due to client browser caching: connection failures tied to browser caching stretched from January 8 at 18:15 UTC to January 22 at 14:19 UTC - 13 days 20 hours.
- OpenAI: FedRAMP workspaces and API orgs have degraded performance: FedRAMP workspace and API org performance degraded from June 15 at 22:12 UTC until June 26 at 23:07 UTC - just over 11 days.
- Deepgram: Voice Agent third-party provider instability (Google Gemini LLMs): Voice Agent instability from an upstream Gemini LLM issue lasted from April 21 at 15:59 UTC to May 1 at 18:21 UTC - 10 days 2 hours. This is an example of an enterprise AI solution provider being affected by an upstream LLM provider issue.
- Google AI Studio: Gemini API is having some issues serving recently created keys (no permalink available): Newly created Gemini API keys had problems from April 17 at 23:00 UTC to April 28 at 01:00 UTC - 10 days 2 hours. The workaround was to create a new key.
Anthropic Fable 5 and Mythos 5 Suspension
Although this was not an outage in the true sense, it deserves mention. Anthropic suspended access to Claude Mythos 5 and Claude Fable 5 from June 13 at 00:50 UTC until July 1 at 19:26 UTC - 18 days 19 hours - in compliance with an export control directive. Resolution fell just outside the H1 window.
The suspension of Fable 5 and Mythos 5 by Anthropic resulted in the following downstream providers being affected:
- Amazon Web Services: Fable 5 and Mythos 5 Access: Bedrock access to both models was disrupted.
- Notion: In compliance with Anthropic and US policy, we have disabled Fable 5 in our product: Fable 5 was disabled in Notion in line with Anthropic and US policy.
- GitLab: Claude Fable is not available through GitLab.com: Fable was unavailable on GitLab.com.
- Netlify: AI Gateway: Claude Fable 5 unavailable: the AI Gateway could not serve Claude Fable 5.
Payment Infrastructure Outages
Payment infrastructure is a critical layer for any SaaS company. Payment outages have an immediate impact, but failed attempts are often retried successfully.
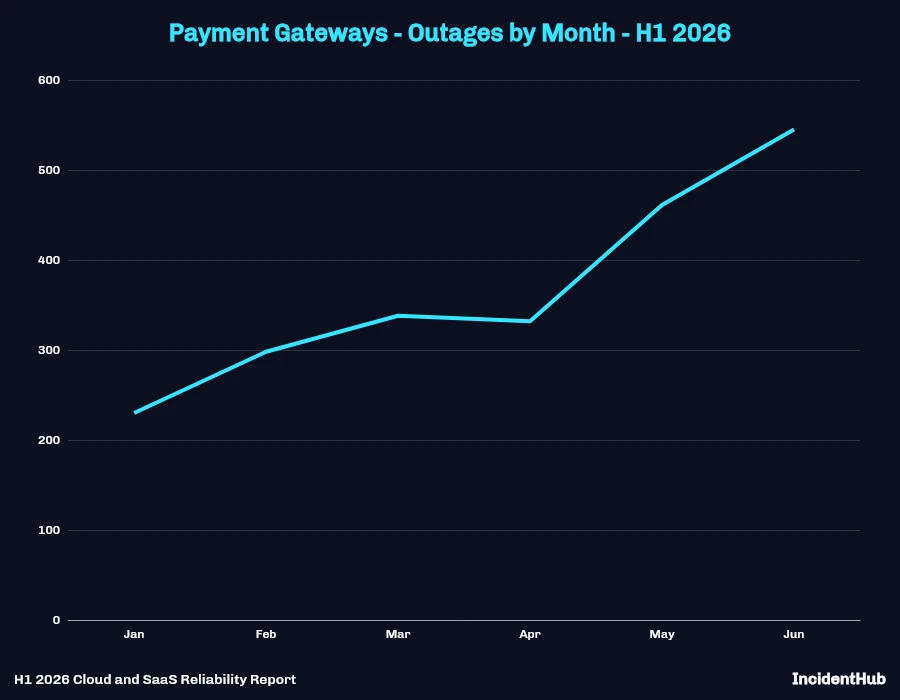
Payments saw 2,204 outages across 33 distinct providers, with outages peaking in June. Outages show an upward trend since January.
Stripe outages peaked in March and May with 11 each.
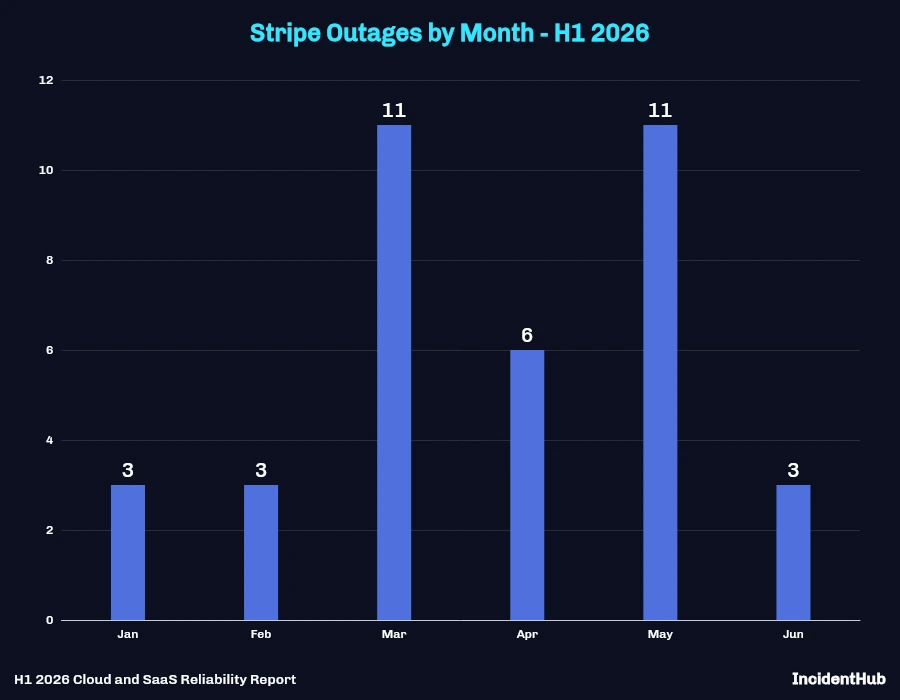
The US Federal Reserve's FedACH Services experienced an internal systems processing outage beginning on March 3, temporarily taking the FedACH application offline and delaying file distribution and settlement for multiple ACH processing windows. This affected US payouts, top-ups, bank debits, and bank transfers flowing through Stripe and other processors, and was also surfaced by Stripe on its own status page.
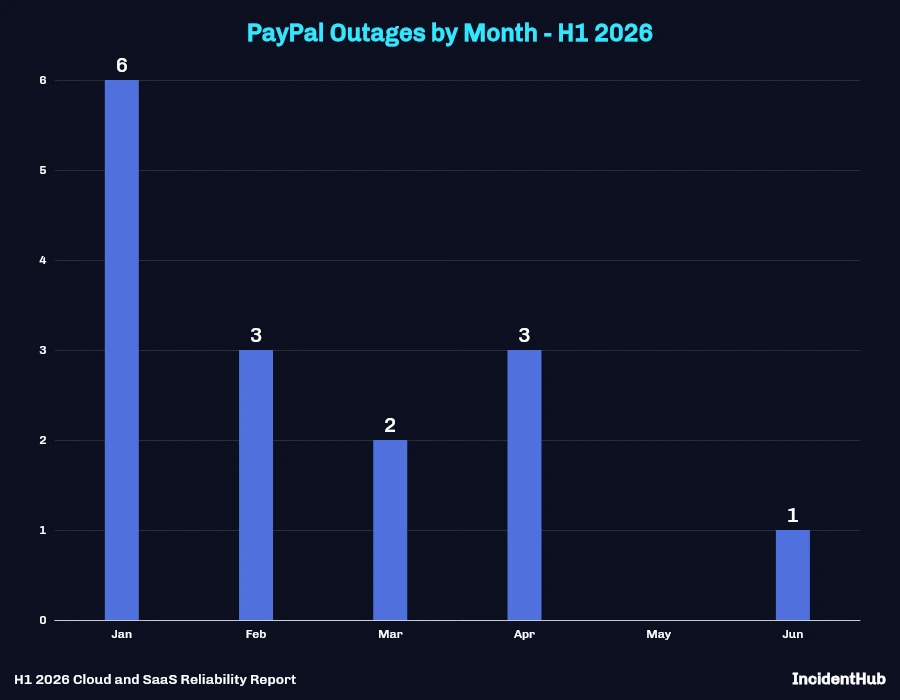
PayPal showed a decrease in outages since January, in contrast to Stripe.
Observability, Monitoring and Incident Management Tools Outages
This is the group that knows about outages of other tools, so outages in this category essentially result in either a slowdown or a complete loss of visibility into whether something is wrong. Monitoring tool outages can result from either their internal issues or issues with the cloud providers they depend on, since most monitoring and alerting tools are themselves cloud-hosted SaaS services.
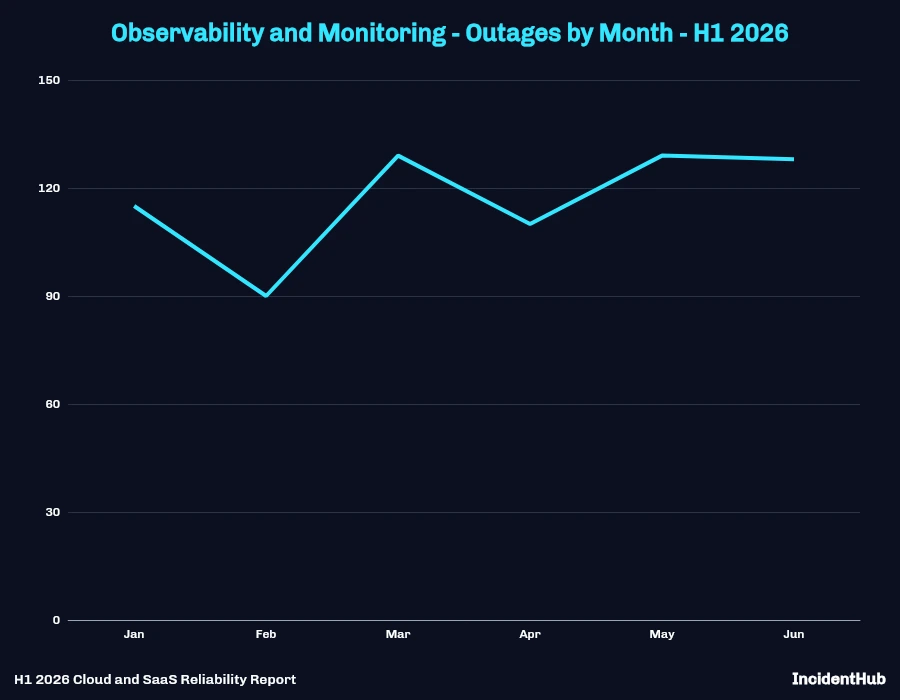
Observability and Monitoring
- 701 outages across 34 distinct providers in H1 2026.
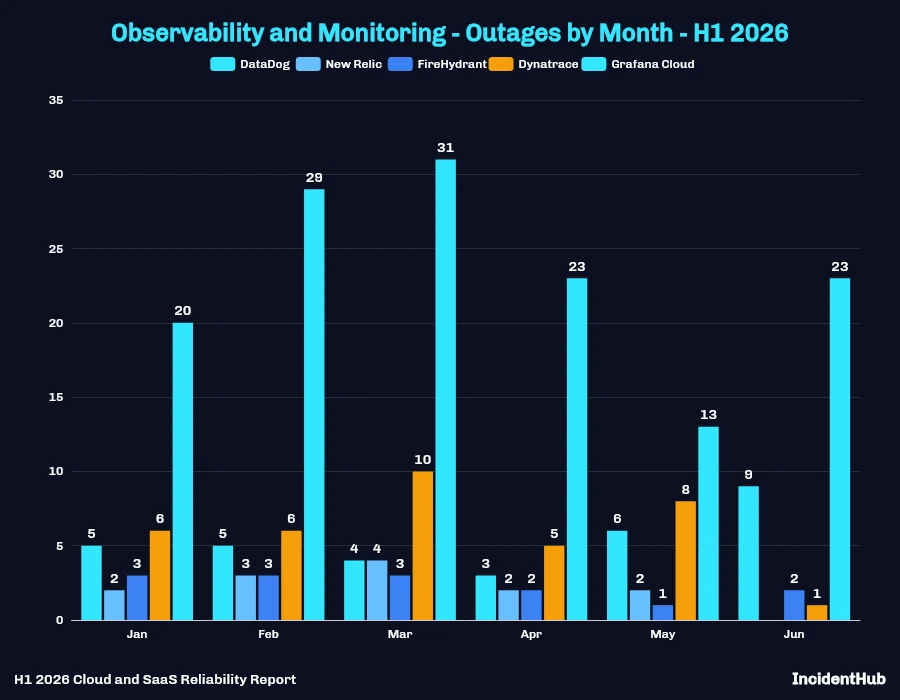
A comparative view of selected observability and monitoring tools:
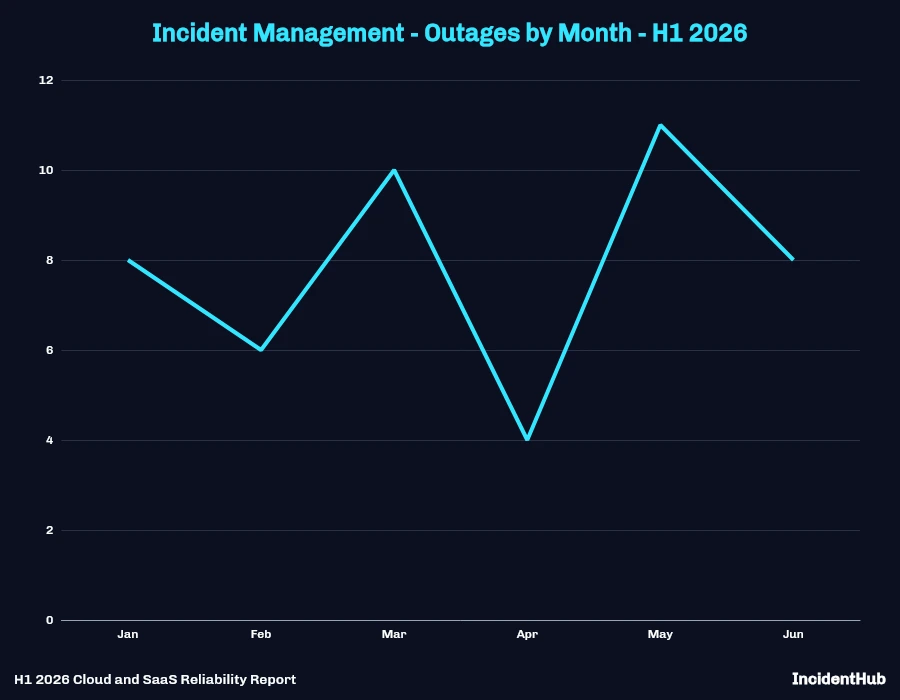
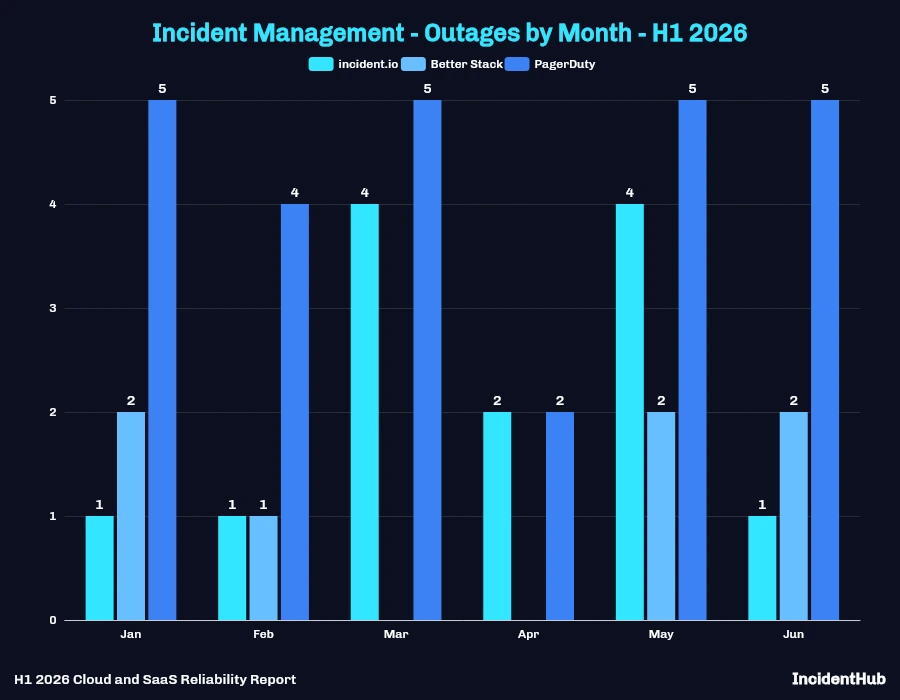
Incident Management
- 47 outages across 4 distinct providers in H1 2026.
A comparative view of selected incident management tools:
EdTech Outages
EdTech is becoming increasingly reliant on AI. In addition to infrastructure, upstream AI providers are also in the mix of factors that can cause outages. EdTech has specific demands like fixed academic calendars, which cannot be rescheduled, and which makes it different from enterprise SaaS. Scalability and reliability, both from the application and from dependent services like auth providers, are critical.
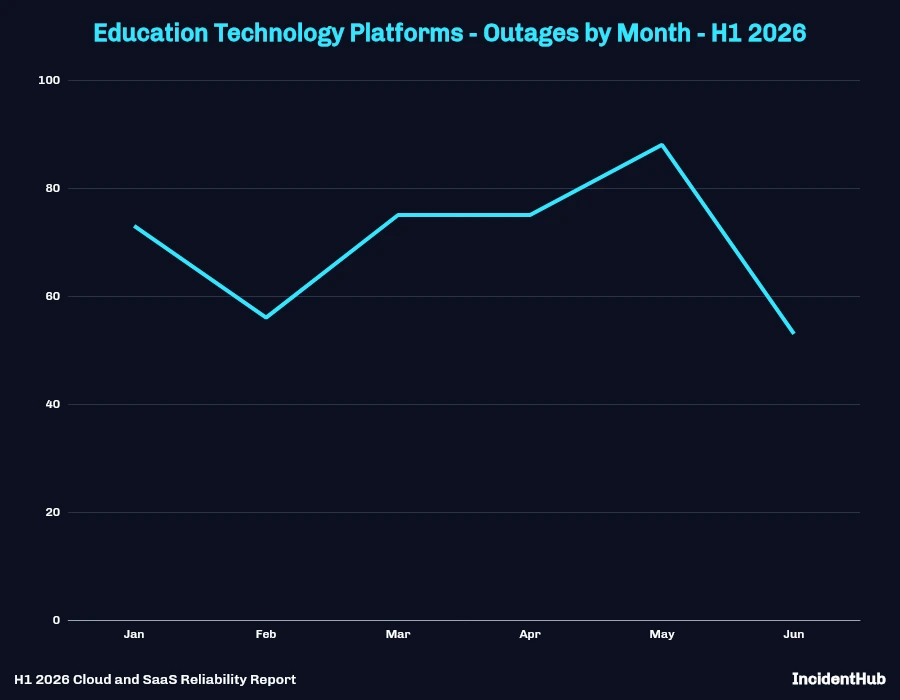
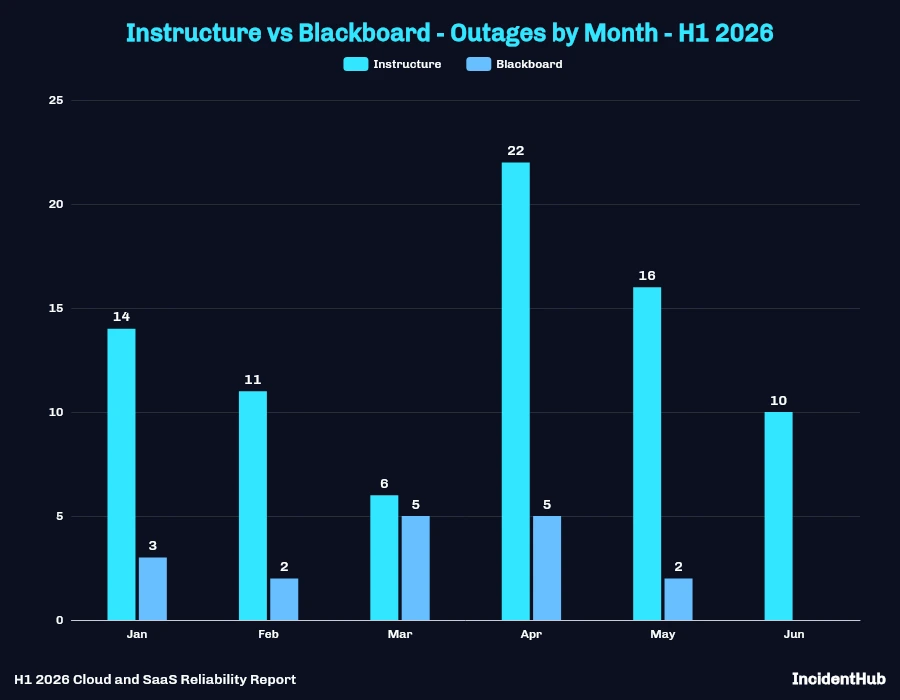
EdTech platforms saw 420 outages across 38 distinct providers. H1 2026 also showed that security-triggered outages - not just infrastructure failures - can take platforms offline at scale, as the Canvas incident in May demonstrated.
Canvas (Instructure) - May 2026 Security-Related Outage
- A security incident attributed to a ransomware group caused a platform-wide outage. The outage occurred during the final exam period for many institutions globally.
- The group claimed that approximately 9,000 institutions were affected; some institutions lost access for multiple consecutive days. In an update, Instructure noted that they have "blocked the unauthorized access, remediated the vulnerabilities and privilege escalation paths used".
H1 2026 Outage Patterns
Cascading Outages
In addition to specific services that caused downstream outages, we analyzed the dataset as a whole.
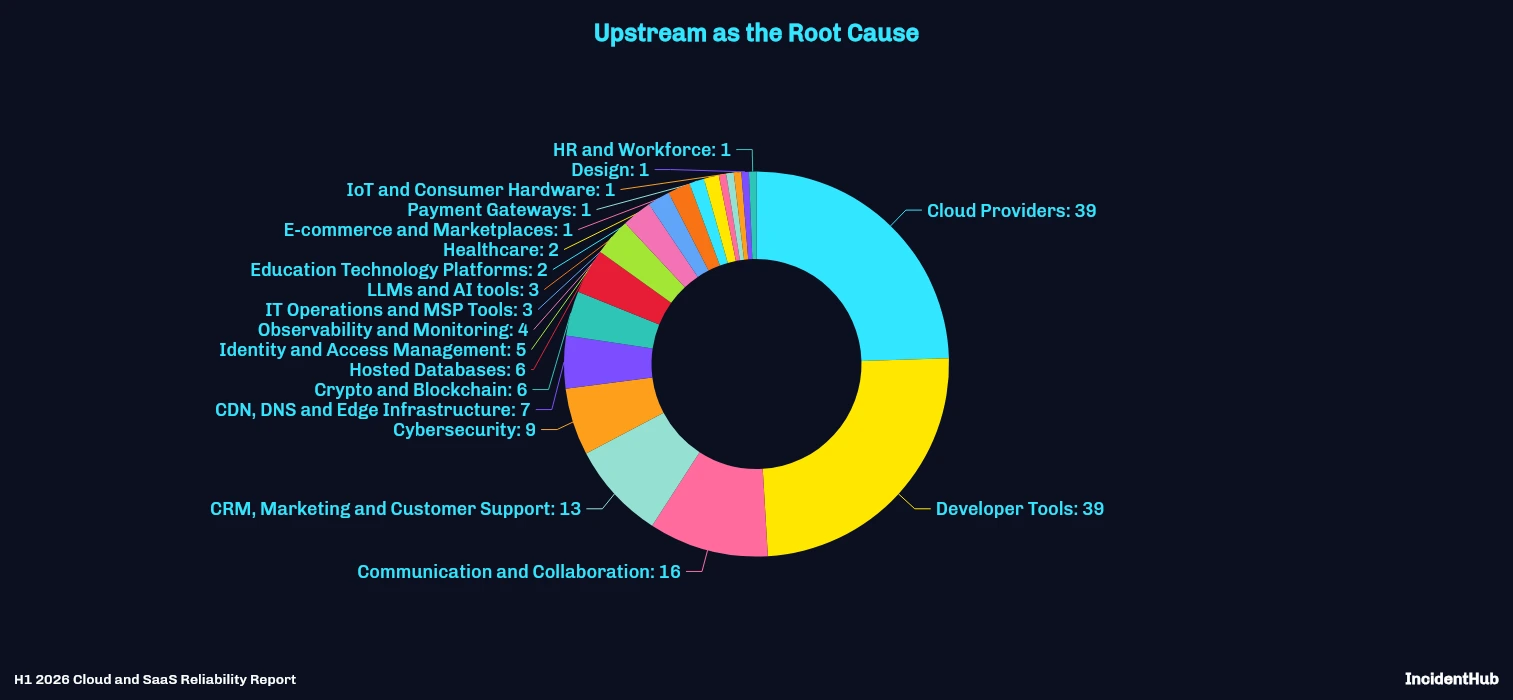
This chart shows how many outages in each category were caused by something that they depended on.
Cloud providers themselves were among the most affected by upstream outages.
This analysis has some caveats:
- This does not reveal second and higher order dependencies.
- This is based on confirmed mentions of upstream outage(s) as the root cause in the provider's own incident report. The actual numbers are likely higher.
Month-by-Month Trend (January - June 2026)
Duration Distribution by Month
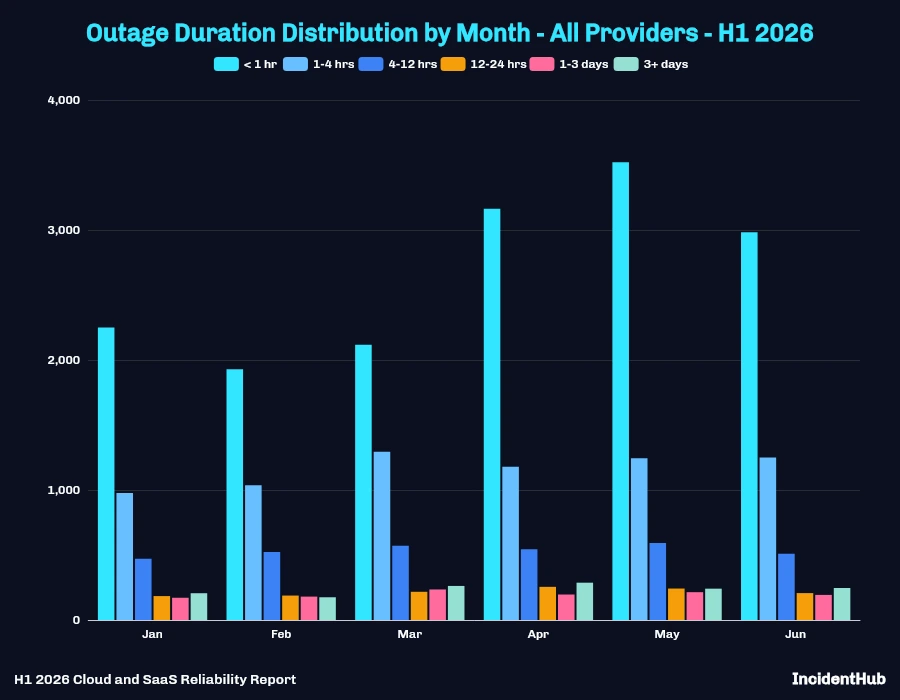
A quick look at the duration distribution by month (across all providers in the dataset) shows these patterns:
- Shorter (< 1 hour) outages are becoming more common.
- The number of longer outages up to 24 hours has more or less stayed the same.
The duration reflects actual resolution times. An incident that started in H1 and resolved in July is counted in its correct duration bucket, including the longest ones. Incidents still unresolved at the time of writing are marked Unresolved and excluded from the duration distribution chart, though they remain in all outage counts.
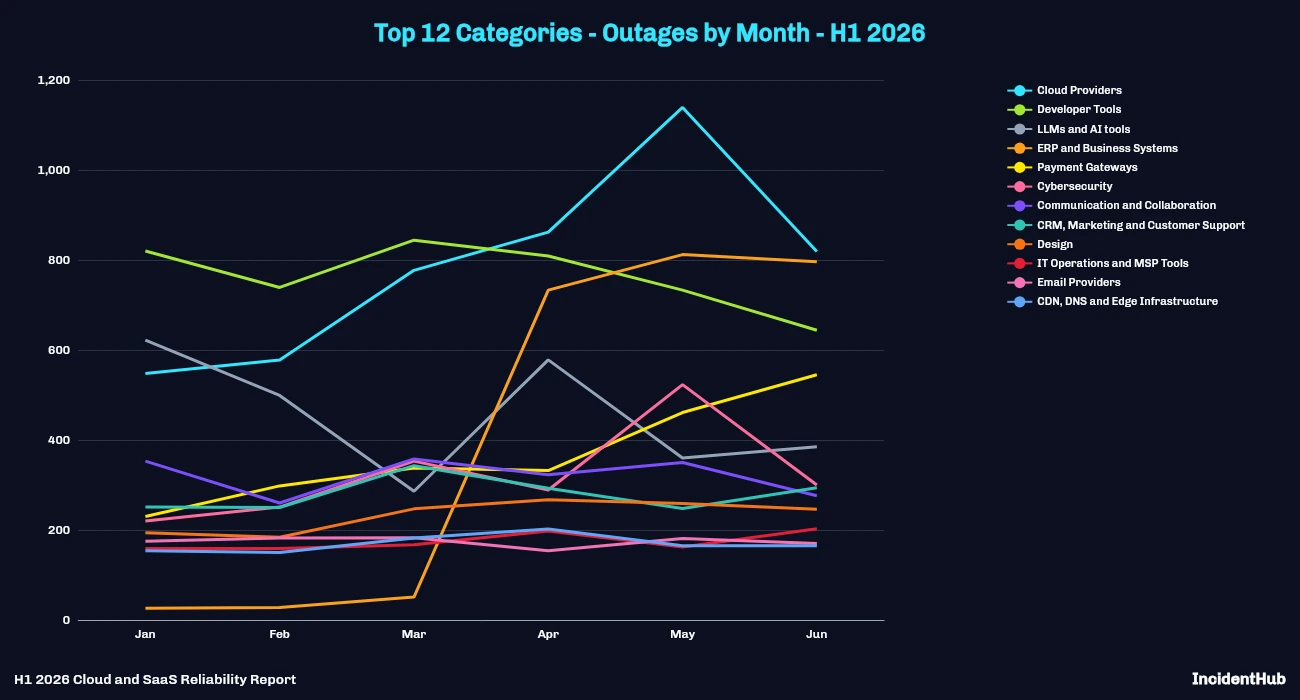
Comparative View of Categories by Month
A comparative view of the top 12 categories by outage counts per month:
Patterns in Distributed Infrastructure Outages
Global Propagation of Localized Trigger Points
The trigger points for outages in globally distributed infrastructure providers are usually localized but they quickly cascade. This is often an outcome of the system's design. Such systems are built to propagate changes quickly, usually in the control plane, across the provider's global infrastructure. A misconfiguration propagates at the same speed as a good one. Examples are:
- Microsoft Azure's February 2026 Outage that affected Azure Virtual Machines, Azure Kubernetes Service, and Azure DevOps was triggered when a remediation policy incorrectly disabled anonymous access on VM extension package storage. This state propagated across public cloud regions, causing control plane failures for provisioning and scaling.
- GCP's June 12, 2025 outage that was caused by a bad automated update to Google Cloud's quota check system. The update propagated across the entire global network, affecting external API requests and impacting many products. Google noted in their incident report that "data replication needs to be propagated incrementally with sufficient time to validate and detect issues".
- Microsoft Azure's October 29, 2025 outage was triggered by incompatible metadata in Azure's CDN. The bad configuration had already propagated to edge servers by the time their internal config protection system detected and stopped new and inflight requests.
- Cloudflare's November 18, 2025 outage - one of the most impactful last year - was caused by a larger than expected file input into their Bot Management system. This change propagated quickly across the world. Cloudflare put into action their "Code Orange: Fail Small" plan to do a controlled rollout for any configuration change that will propagate across the network to prevent such issues.
Automated Policy Enforcement as a Risk
GCP's automated suspension of Railway's production account is the most recent example of this. As automated enforcement becomes more common in cloud platforms, organizations will need to treat this as a risk to prepare for. Solving this at the architecture level is the best way to prepare for it.
Control Plane Resilience Matters More
The data plane can stay healthy while the control plane fails. Even if your VMs, databases, etc are resilient to a single zone or even a single region failure, but your control plane is not, a failure in the latter can render your application unusable. A multi-cloud approach is often touted as a way to achieve resilience. Notwithstanding the technical complexities of a multi-cloud approach, combined with the fact that your dependencies may not be multi-cloud, a resilient control plane should be a key part of your approach.
Recovery Can Trigger Secondary Outages
Depending on the nature of the outage, recovery can trigger subsequent, smaller issues. Queued jobs, thundering herd issues, and rate-limiting by third-party services (triggered by requests from the recovering service) can all slow down the overall recovery process.
Conclusion
H1 2026 was defined by dependency risk. Across 30,246 outages and 1,082 providers, cloud providers and developer tools had the highest volume of outages. Many incidents with wide reach originated one layer upstream, in edge and CDN networks, identity providers, LLM APIs, or a cloud control plane. May was the heaviest month.
The first half of 2026 also produced failure modes that outage duration and count do not capture. Outages resulting from automated policy actions (Railway), security incidents (Canvas), AI model access suspension (Fable 5 and Mythos 5) were the significant ones.
Four patterns held across the data. Localized triggers propagate globally when control planes are built for fast replication. Outage recovery generates its own load and can extend an incident well past the original fault. Shorter outages are becoming more common. Automated policy enforcement is a risk to consider.
This report is a record of what providers published on their public status pages between January 1 and June 30, 2026. It is not a measure of customer impact, and the outage counts are not a reliability ranking: providers differ widely in what they choose to publish, and this report does not normalize for severity. The counts are for status page activity.
The practical takeaway is to know your first- and second-order dependencies, and watch them in one place. A vendor outage monitor like IncidentHub surfaces upstream outages across cloud, SaaS, AI, and edge providers before your users report them.
FAQ
How many Cloud and SaaS outages were there in H1 2026?
IncidentHub tracked 30,246 outages across 1,082 providers between January 1 and June 30, 2026. Only providers with continuous monitoring coverage for the full 6 months are included in the aggregate figures.
Which category had the most outages in H1 2026?
Cloud Providers led with 4,723 outages across 86 providers. Developer Tools came second with 4,589. Those two categories also topped the list for confirmed upstream provider outages as root causes.
Which month had the most outages in H1 2026?
May 2026 was the busiest month, with 6,070 outages. Cloud provider outages also peaked in May at 1,139 across 67 providers.
What caused the Railway outage on May 19, 2026?
Google Cloud automatically suspended Railway's production account. It took down Railway's API, control plane, and databases. Edge proxies kept serving briefly from cached routing tables, but once those expired, workloads became unreachable - including workloads that were healthy on Railway Metal and AWS - because the control plane that routed traffic to them was offline.
Why do AI and LLM outages matter for SaaS reliability?
LLM APIs are now embedded in developer tools, customer support, communication, and productivity products. When an upstream model or API fails - or when access is suspended, as with Anthropic's Fable 5 and Mythos 5 - dependent products often have little fallback and must degrade features or disable them entirely.
How can I monitor cloud and SaaS outages across my dependencies?
Manually checking dozens of status pages does not scale when outages cascade across cloud, edge, IAM, and AI providers. A status page aggregator like IncidentHub monitors public status pages in real time and can alert you on the specific services and components you depend on.
All images are generated from IncidentHub's aggregated data. If you wish to reuse them, please do so with attribution.
IncidentHub is not affiliated with any of the services and vendors mentioned in this article. All the logos and company names are trademarks or registered trademarks of their respective holders
This article was first published on the IncidentHub blog.
You might also like: