Product Update - July 2026


What's New in IncidentHub in July 2026?
IncidentHub's latest product update includes a Multi-Client plan built specifically for MSPs and agencies with per-client status pages, service components as top-level objects on status pages, and support for more vendors (1125+ and counting).
- What's New in IncidentHub in July 2026?
- Per-Client Status Pages in a New Plan
- Service Components As Top-Level Objects in Status Pages
- New Services
Per-Client Status Pages in a New Plan
MSPs and agencies usually monitor a specific catalog of vendors, whereas their clients use different subsets of that catalog. One client may run Xero, Microsoft Teams, and Azure; another may use MYOB, Slack, and Google Cloud. A single status page that lists everything is noise for each of them.
The Multi-Client plan is built to fulfill these needs. From one IncidentHub account you can create upto 50 public status pages. Each page is a filtered view of the services you already monitor - pick the subset for that client, brand it, and give them the link. Duplicate an existing page when the next client is mostly the same stack with a few swaps.
Technically this is not a second account and not Teams. You set up monitorinf for the full catalog once. Alert settings, components filters, and notification channels stay account-wide. Only the published page differs per client.
Setup steps are:
- Monitor the vendors (and regions/components) you care about.
- Create or duplicate a status page per client.
- Under Services, select the subset for that page. Empty means show all monitored services.
- White-label branding and, if needed, a custom domain per page.
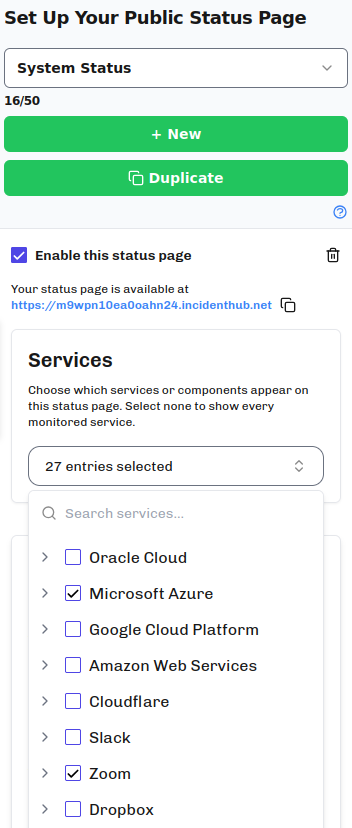
Custom domain setup is not self-serve yet - email us and we configure it.
Each page can also sit on its own {pageId}.incidenthub.net subdomain if you don't want a custom domain.
If you need independent monitors, channels, and alert configs per group inside one org, Teams on the Business plan remains the better fit. If you need one branded page per end-client with a shared monitor list underneath, Multi-Client is what you need. The docs cover both: per-client status pages and when not to use Teams.
For the longer rationale - what clients need during a vendor outage, hosted page vs webhook dashboard, and the limits - see Vendor Outage Monitoring for MSPs.
Service Components As Top-Level Objects in Status Pages
Previously, a status page listed services as top-level cards. Components and regions still decided what counted as an outage for that service - if you monitored only certain components, unrelated incidents stayed out - but the page itself showed one row per service.
That is enough when the question is "is Xero up?" It is not enough when two clients (or two audiences) care about different slices of the same vendor. E.g. one page may need Cloudflare status for Oceania, another for North America, without showing the rest of Cloudflare as a single aggregate.
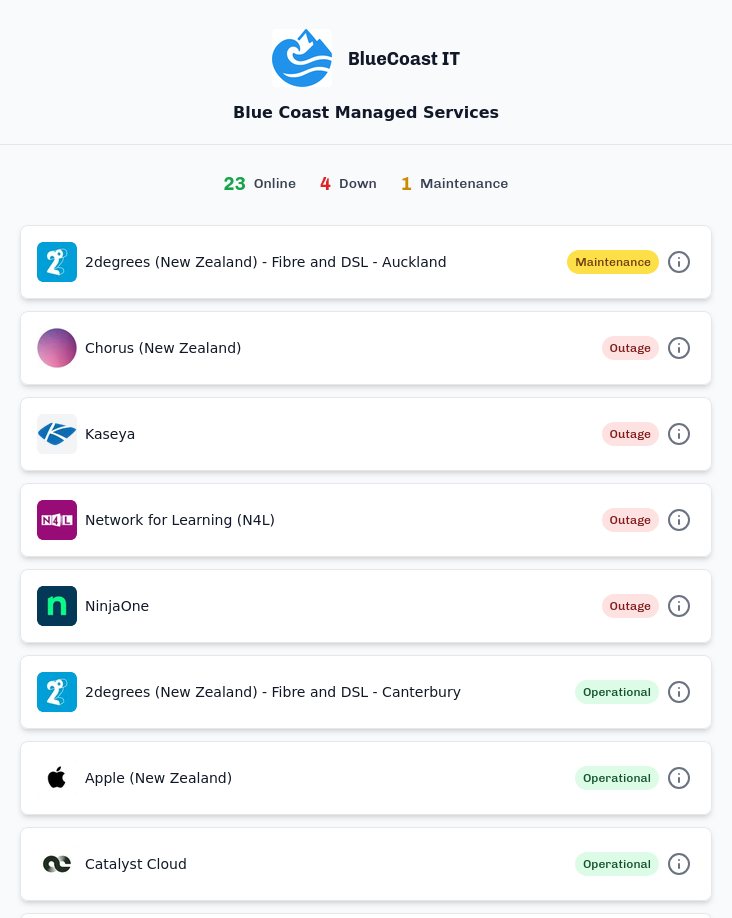
You can now put individual monitored components on a status page as separate top-level cards. E.g. different clients that use localizated components for the same provider: e.g. Cloudflare Oceania, Cloudflare North America, etc. depending on their location, can choose to see only the regional components on their status page.
You can choose this in the Services selector when you are creating or editing a status page on the Multi-Client plan: a full service, or first-level groups, or specific second-level components. This list is built from the components you monitor for that service.
Card titles follow the component hierarchy - e.g. Twilio - CONVERSATIONS, or Cloudflare - Durable Objects - Asia.
Incidents and history on that card are scoped to the selected component(s).
A few boundaries worth stating:
- This is a status page presentation change. The maintenance widget and the affected components and history popup widgets on the status page are also affected if you choose components as top-level objects. Add/Edit monitoring, the dashboard outage and maintenance widgets, the availability dashboard, and alerts are unchanged.
- You cannot break a service into components on the page if you monitor that service as "all" in Add/Edit - the selector only offers a component breakdown when you monitor specific components.
- A page never shows both an aggregate service card and component cards for the same service at once.
If you leave the Services selection empty, the page still shows all monitored services - same default as before. You can always edit the page later to add components.
New Services
We've added support for more vendors including ServiceNow, Azure DevOps, Intuit QuickBooks, N-able, Pax8, Sophos, SonicWall, Vultr, ThreatLocker, and xAI, to name a few. This brings up the total number of supported vendors to 1125+.
Keep watching this space for more updates to IncidentHub.
IncidentHub is not affiliated with any of the services and vendors mentioned in this article. All the logos and company names are trademarks or registered trademarks of their respective holders
This article was first published on the IncidentHub blog.